
5 Minutes
Ethereum weakness intensifies as December closes
Ethereum lost notable ground in December, slipping roughly 14% from its monthly peak and trading near the $3,000 area as the year ended. Institutional demand for spot Ether weakened sharply during the month, with nearly $545 million exiting U.S. spot ETH exchange-traded funds — a continuation of the outflow trend that accelerated in November. That broad pullback in capital, combined with muted activity among derivatives traders, has left ETH vulnerable to further losses.
ETF outflows and market sentiment
Institutional selling pressured both price and sentiment. Data show the nine U.S. spot Ethereum ETFs recorded nearly $545 million in net outflows in December, following a far larger $1.42 billion withdrawal in November. With fewer fresh dollars flowing into spot ETH products, market depth thinned and retail confidence deteriorated.
Derivatives metrics underline the same story. Futures open interest for Ethereum has been range-bound around $35–40 billion in recent weeks — well below the roughly $70 billion seen in August — signaling that traders have been unwinding leverage and taking fewer directional bets. Declining open interest often coincides with reduced speculative interest and can make price moves more pronounced when large orders do hit the market.
Investor risk appetite also turned cautious. A hawkish tilt from the Federal Reserve heading into 2026 has pushed some investors away from risk-on assets like ETH toward perceived safe havens. At the time of writing, the Crypto Fear & Greed Index registered a reading of 21, reflecting persistent extreme fear that typically suppresses crypto prices.
Technical picture: bearish pennant and moving averages
On the daily chart, Ethereum has formed a multi-week bearish pennant — a consolidation structure that often follows a steep sell-off and can precede further declines if price breaks lower. Traders monitor such patterns closely because a confirmed breakdown commonly signals a continuation of the prior downtrend.
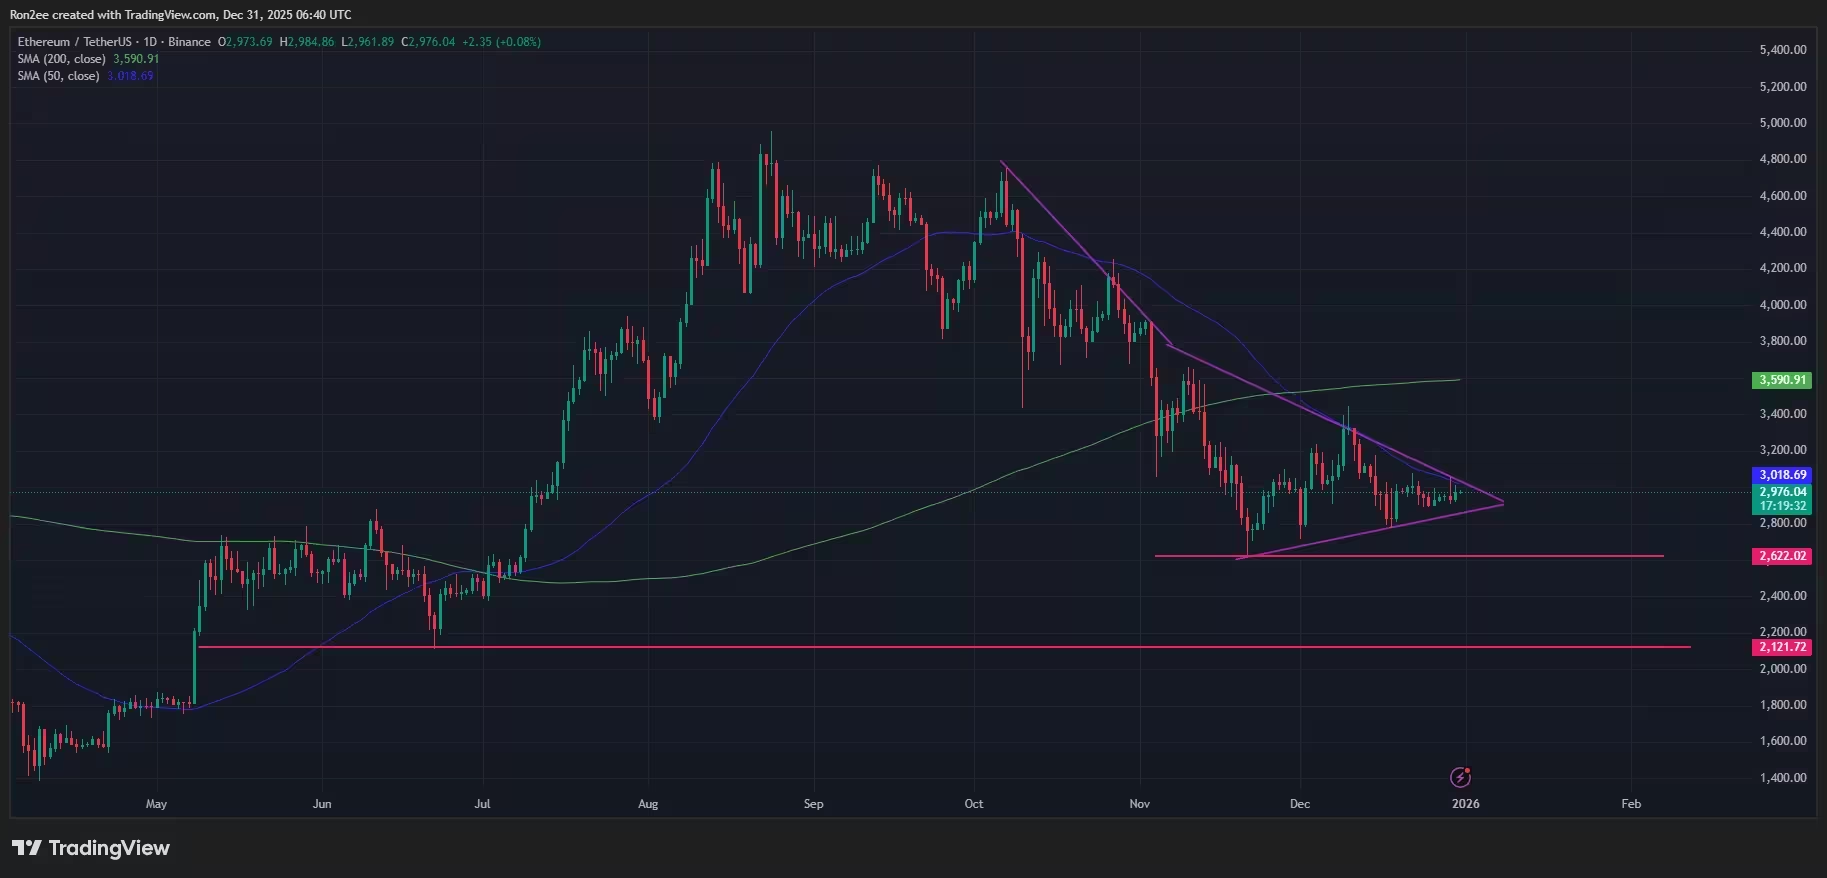
Ethereum price has formed a bearish pennant pattern on the daily chart — Dec. 31
Technical indicators add weight to the downside case. The 50-day simple moving average recently crossed below the 200-day SMA, producing a classic "death cross" configuration that many analysts interpret as a medium-term bearish signal. ETH is trading below its 50-day average, indicating that shorter-term momentum favors sellers.
The Supertrend indicator has also flipped to red after moving above current price levels, a condition traders often use as a sell or short signal. Taken together, the pennant, the death cross and the Supertrend reading suggest elevated downside risk unless buyers reassert control.
Potential targets and invalidation level
If the bearish pennant resolves to the downside, Ethereum could revisit the Nov. 21 intraday low near $2,622 — a logical short-term target given the lack of significant support between present levels and that low. Conversely, a decisive break above the immediate psychological resistance at $3,100 would invalidate the bearish pattern and could trigger a short-term recovery as momentum shifts back to buyers.
What traders should watch
Key metrics for traders and investors to monitor include: ongoing flows into and out of spot ETH ETFs, futures open interest, on-chain netflows, and macro policy signals from central banks, especially the Federal Reserve. A sustained reversal in ETF flows or a pickup in futures open interest could support a recovery in ETH, while continued outflows and falling liquidity would amplify downside risk.
Risk management remains essential. Given the current macro backdrop and technical setup, many market participants are adopting more conservative position sizing and tighter risk controls to navigate elevated volatility.
Conclusion
Ethereum enters the new year on the back foot. Institutional outflows, tepid derivatives activity and bearish technical signals — including a daily bearish pennant and a death cross — point to possible additional losses for ETH if selling persists. A solid break above $3,100 would shift the narrative and offer a path toward a short-term rally, but until buying pressure returns, downside scenarios remain the more probable near-term outcome for the largest altcoin.
Source: crypto
Comments
Reza
This is rough. Death cross + pennant = ugh. Could revisit 2,622 if selling keeps up. Fingers crossed.
blocktone
Wait are those ETF outflows real? 545M in Dec alone… liquidity drying up fast risky, huh?
Leave a Comment