

Bitcoin slips under $82,000 as ETF outflows and liquidations weigh
Bitcoin fell below the $82,000 mark on October 23, sliding to about $81,449.88 after losing momentum near the $85,000 resistance area. The pullback followed a failed attempt to sustain gains above $84,000 and coincided with notable outflows from U.S. spot Bitcoin ETFs. Market participants also faced a surge in derivatives liquidations during the 24-hour downturn, reinforcing short-term bearish pressure across the crypto market.
Key market snapshot
- Bitcoin price: $81,449.88 (intraday low refreshed near $80,989)
- 24h trading volume: approx. $29.85 billion
- Market capitalization: about $1.64 trillion
- ETF net flows (Oct 22): $635.49 million outflow
- Derivatives liquidations: ~$406.27 million affecting roughly 89,596 traders
These figures reflect the immediate market reaction to both capital movement into and out of Bitcoin-linked products and intensified risk-off behavior among leveraged traders.
Spot ETF flows flip to outflows
After three consecutive sessions of inflows that totaled roughly $1.08 billion, U.S. spot Bitcoin ETFs registered a sizable reversal on October 22 with $635.49 million in net redemptions, according to SoSoValue. The inflow streak had included a $526.6 million addition on October 19, a modest $23.16 million on October 20, and another $528.4 million on October 21.
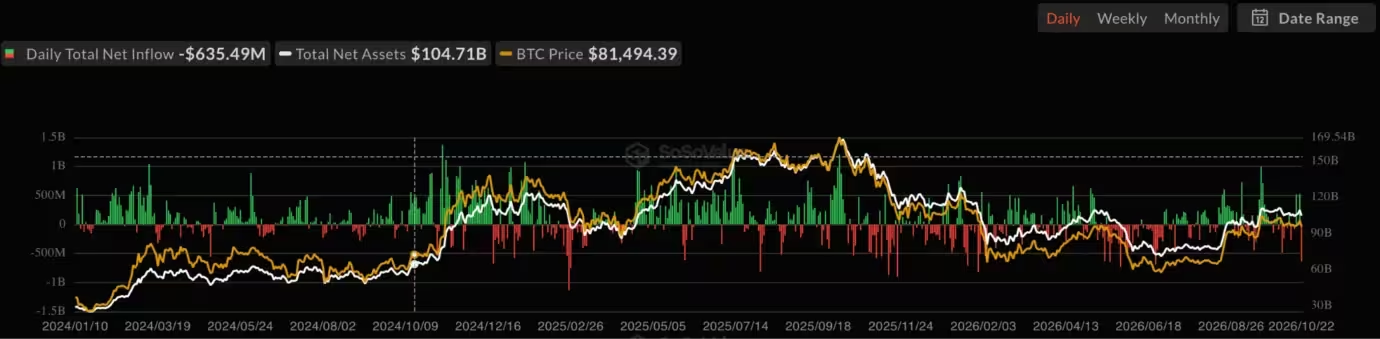
Bitcoin spot ETF Net flows
The October 22 withdrawals marked the largest single-day ETF outflow since June 25 and nudged the month-to-date net ETF flows into negative territory, around $174.5 million in net redemptions. While ETF flow data does not establish causation for price moves on its own, the reversal in flows likely amplified near-term selling pressure and investor sentiment toward BTC.
Derivatives liquidations accelerate
Derivatives markets amplified the move lower. CoinGlass recorded approximately $406.27 million in total crypto liquidations over the prior 24 hours, impacting roughly 89,596 traders. The largest single liquidation reported was a BTC-USD position on Hyperliquid valued at about $7.93 million. These liquidation totals cover the broader crypto market, not only Bitcoin, but they illustrate how leveraged positions can deepen market moves when collective selling resumes.
Rising concerns about excessive leverage had been flagged earlier by exchanges and analysts, with futures open interest and concentrated positions creating vulnerability to rapid price shifts if sentiment turns negative.
Macroeconomic drag on crypto risk appetite
Macro factors added complexity to the market backdrop. Rising energy costs, particularly Brent crude remaining above $100 per barrel amid Gulf tensions and attacks on Russian refineries, prompted analysts to flag potential spillovers into inflation and liquidity conditions. Crypto analyst Darkfost highlighted the risk that higher energy prices could constrain economic growth and reduce the pool of capital available for speculative assets.
Although a direct causal link between oil prices and Bitcoin performance is not definitive, the broader macro picture can influence risk-on appetite and liquidity for crypto markets.

Technical picture: reclaiming $82.5K is pivotal
From a technical standpoint, Bitcoin needs to reassert control above the Keltner Channel middle band, currently near $82,559, to restore short-term bullish momentum. At the time of the downturn, BTC was trading around $81,906.77 and below the channel middle line, with the lower Keltner boundary positioned close to $78,421.85.
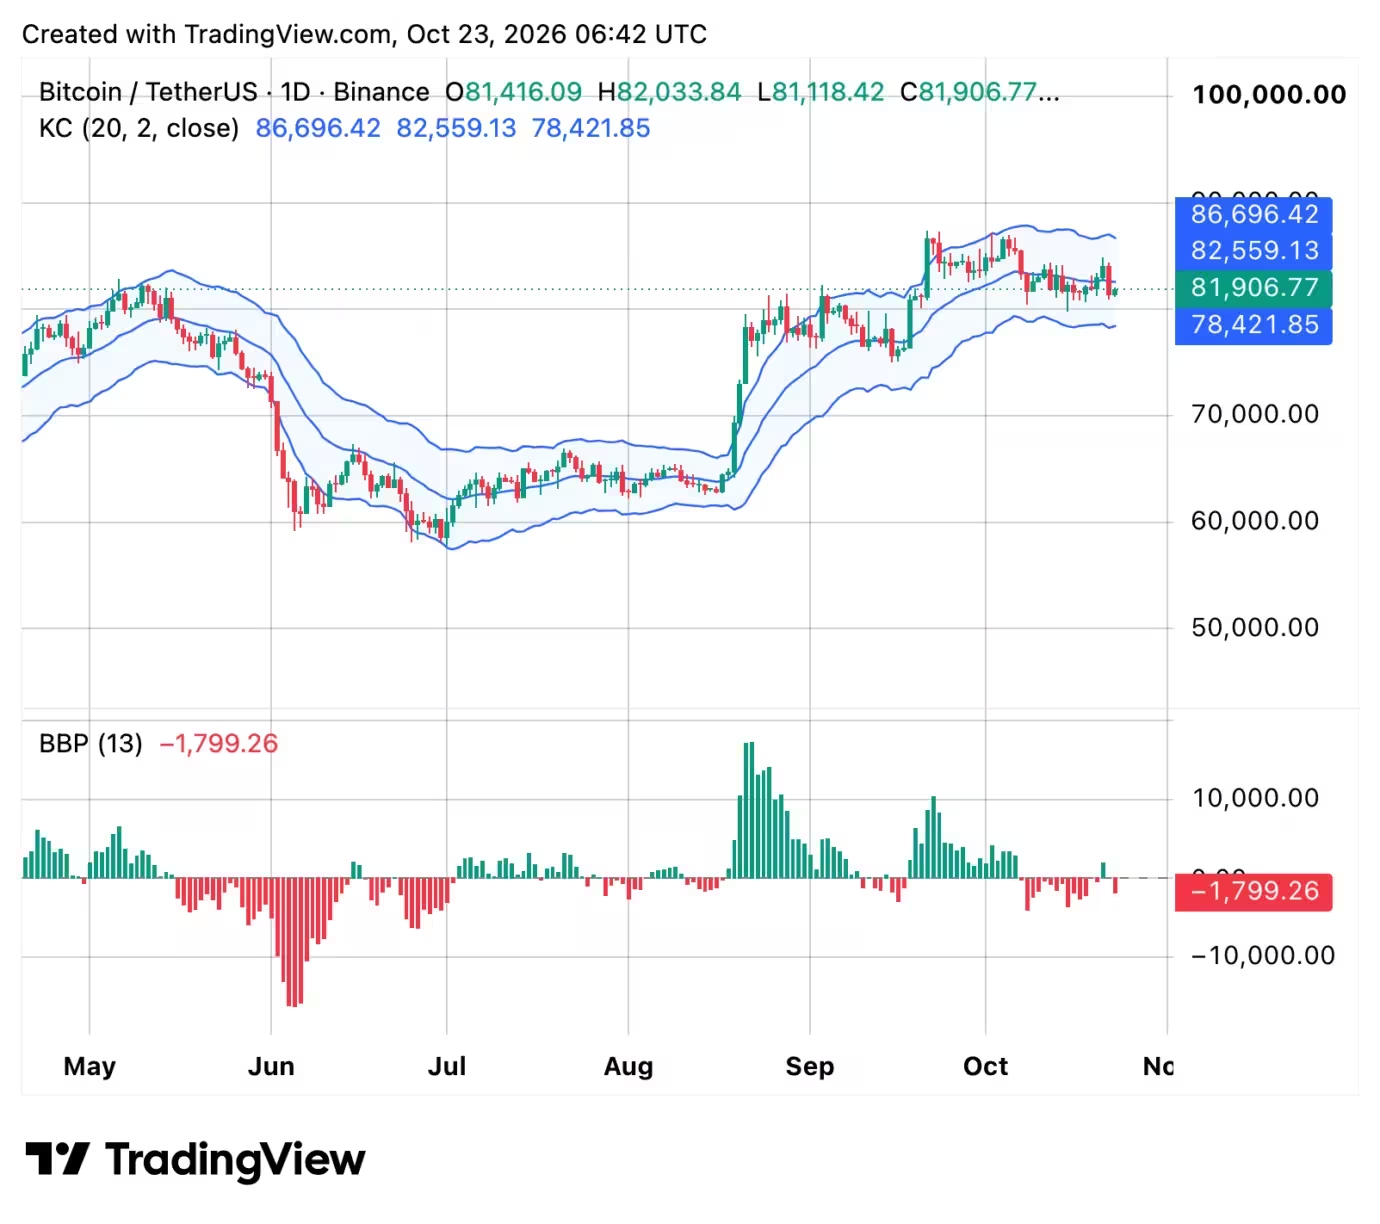
Bitcoin (BTC) price chart
A decisive move above $82,559 could shift market structure toward a recovery and expose the upper channel boundary near $86,696. Failure to reclaim the middle band would likely leave BTC vulnerable to revisiting the $80,000 support zone and potentially testing the lower channel area.
The Bull Bear Power indicator remained negative, signaling seller advantage, but the contracting negative histogram bars suggest that bearish momentum may be moderating rather than accelerating into a fresh capitulation.
Levels to watch
- Immediate resistance cluster: $82,500 to $82,900
- Short-term resistance extension: $84,000 and $86,500 to $86,700
- Near-term support: $80,000
- Secondary support area: $78,400 to $79,700
- Deeper downside target if channel fails: around $75,000
Crypto strategist Michaël van de Poppe identified $82,900 as a level that would negate the recent bearish sequence, while also flagging $78,400 to $79,700 as a key zone if Bitcoin falls under $80,000.
Other analysts, including Alex Marzell and Satoshi Stacker, emphasized the importance of the $81,000 to $82,000 channel support and warned that a daily close below the 50-day moving average could produce mixed historical outcomes for subsequent BTC performance.
Short-term outlook and trading implications
For traders and investors, the immediate focus is whether BTC can reclaim the $82.5K area and stabilize above the Keltner middle band. That would increase the probability of a measured recovery attempt toward $85K and above. Conversely, sustained weakness below $81K would shift emphasis toward the $80K psychological level and the $78K–$75K structural supports, where buyers might reemerge.
Leverage management remains crucial in this volatile environment, as the recent $400M-plus in liquidations demonstrates how quickly leveraged positions can be wiped out when sentiment turns.
Liquidity and ETF flow metrics will also be closely watched. Renewed ETF inflows could help underpin price, while further redemptions would likely exacerbate selling pressure.
What investors should monitor
- Daily spot ETF flows and net subscriptions or redemptions
- Derivatives funding rates and open interest across major exchanges
- Key technical levels: $82.5K, $85K resistance; $80K, $78K support
- Macro signals including energy prices, inflation data, and global liquidity trends
Conclusion
Bitcoin's retreat below $82,000 on October 23 reflects a confluence of factors: a reversal in spot ETF flows, sizable derivatives liquidations, and an uncertain macroeconomic backdrop. Short-term recovery hinges on reclaiming the mid-$82K band and stabilizing above key technical thresholds. Until flows and leveraged positions normalize, traders should expect elevated volatility and prioritize risk controls while monitoring ETF inflows, liquidity conditions, and broader market news.


Leave a Comment
Comments
No comments yet. Be the first.