
4 Minutes
Ethereum eyes recovery as U.S. spot ETH ETFs return to inflows
Ethereum is trading near $3,857 after a brief pullback, with market participants watching U.S. spot ETH ETF flows for signs of renewed momentum. After three straight days of redemptions, spot exchange-traded funds added $141.6 million on Oct. 21, led by Fidelity and BlackRock — a development that has lifted short-term sentiment for ETH.
ETH slipped 0.2% over the past 24 hours and has traded between $3,709 and $4,183 over the last seven days. The token is down about 10% over the past 30 days and roughly 6% week-over-week, still 21% below its August peak near $4,946. Trading volume and derivatives activity, however, point to increasing market engagement that could support a recovery.
Spot ETH ETFs resume inflows
ETF flow breakdown
Data from SoSoValue shows net inflows of $141.6 million on Oct. 21. Fidelity’s FETH led with $59.07 million, while BlackRock’s ETHA contributed $42.46 million. Grayscale’s Mini ETH and ETHE added $22.58 million and $13.14 million, respectively. Notably, no U.S. spot ETH ETFs reported net redemptions that day, signaling broad-based demand within the ETF ecosystem.
Analysts say continued ETF demand could provide a short-term bid for ETH, especially if flows persist into late October. ETF inflows are a direct on-ramp for institutional and retail capital, and sustained purchases could push prices toward key resistance ranges.
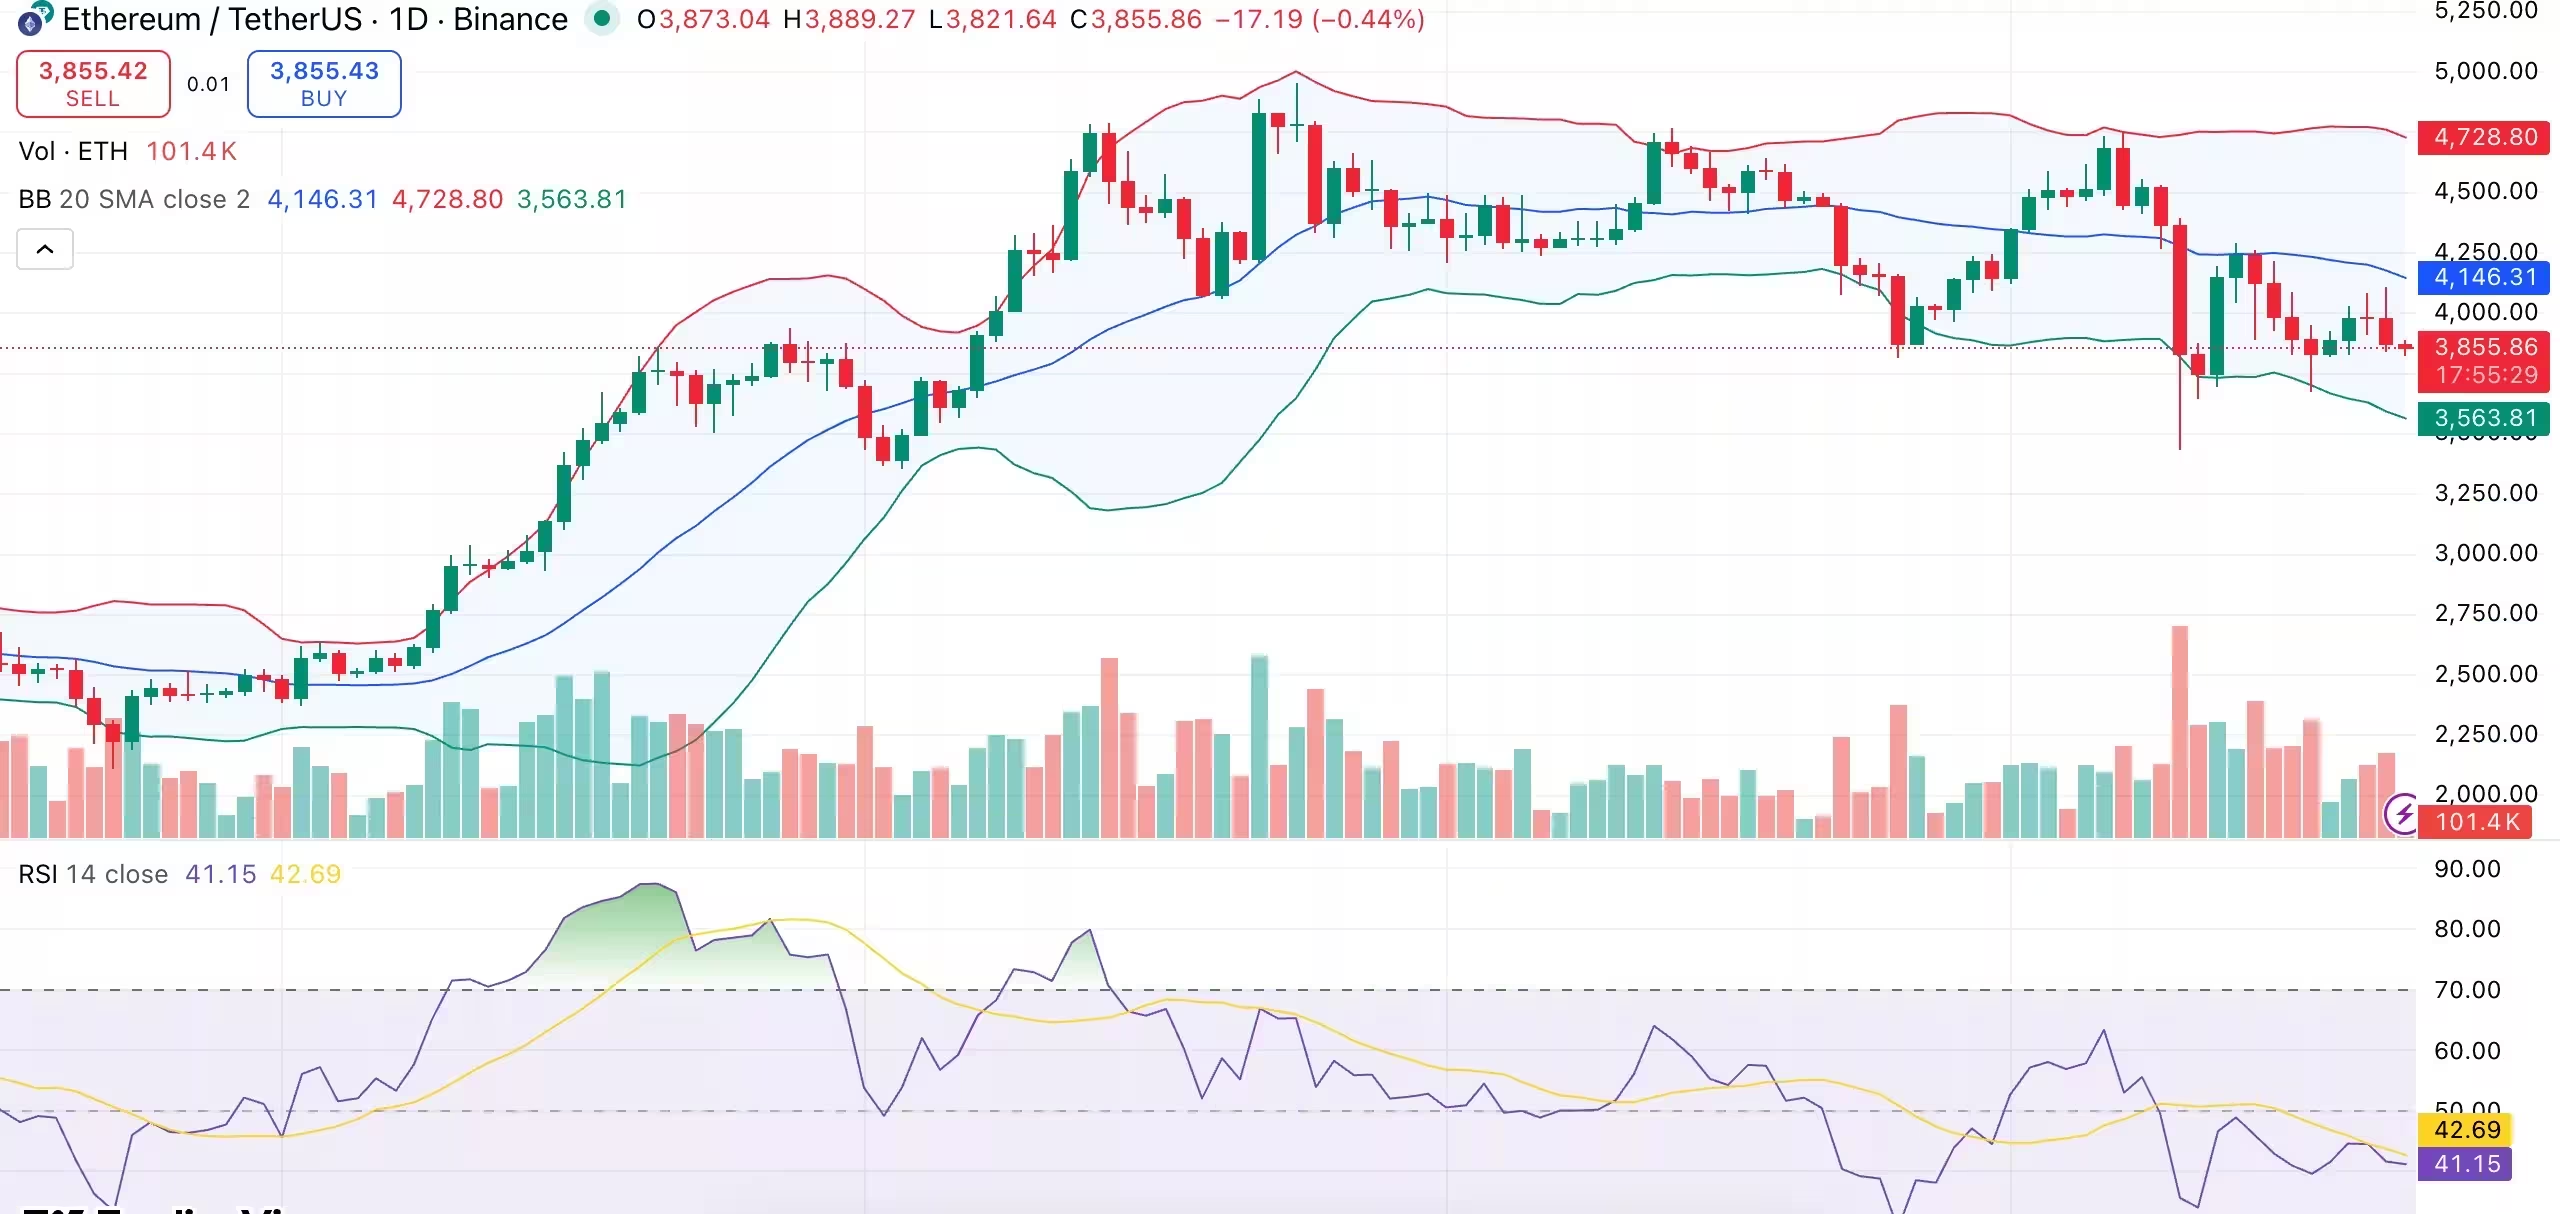
Ethereum daily chart.
Macro backdrop: FOMC and liquidity implications
Rate decision risk and market expectations
Investors are also eyeing the Federal Reserve’s FOMC meeting on Oct. 28–29. Markets are pricing in roughly a 95% chance of a 25 basis-point cut, which could improve liquidity conditions for risk assets, including cryptocurrencies. A dovish signal might accelerate inflows into ETFs and spot markets, while a surprise hawkish stance could reintroduce macro pressure and cap gains for ETH.
On-chain and derivatives activity
Ethereum’s 24-hour spot trading volume climbed 35.2% to $45.8 billion, and derivatives volume rose 57.3% to $114.2 billion, according to CoinGlass. Open interest increased 0.6% to $43.8 billion, suggesting traders are gradually rebuilding positions after last week’s correction. Higher volumes and rising open interest typically indicate renewed conviction among leveraged and institutional traders.
Technical outlook: support, resistance and indicators
Key levels and momentum
On the daily chart, ETH trades below the Bollinger Band midline at $4,146, with resistance observed near $4,720 and immediate support around $3,563. Narrowing bands point to price compression, which often precedes a significant directional move.
The relative strength index (RSI) sits at about 41.15, not yet in oversold territory but signaling mild bearish momentum. A sustained bounce above the 45–50 RSI range could confirm a short-term recovery, while a break below 40 may open the door to further downside.
Most short- and medium-term exponential moving averages (10-, 20-, 50-, 100-day EMAs) are indicating sell signals, underscoring current weakness. The 200-day EMA near $3,570 remains lower, preserving a longer-term uptrend bias.
If spot ETH ETF inflows continue and the Fed signals a rate cut, ETH could gain traction above $3,900 and retest the $4,350–$4,500 zone. Conversely, slowing inflows or a hawkish macro surprise may push ETH below $3,800, exposing supports at $3,560 and potentially $3,400.
Source: crypto
Leave a Comment