
4 Minutes
Solana price under pressure as on-chain stablecoin liquidity shrinks
Solana (SOL) is showing increasing signs of vulnerability after a fresh contraction in on-chain stablecoin liquidity and the emergence of bearish technical signals on the daily chart. The token has retraced from its monthly highs, reflecting weaker demand and broader market risk aversion.
Key market movements and supply data
Data tracked across the Solana ecosystem highlights a notable drop in stablecoin reserves. Over the past seven days, stablecoin supply on Solana fell by roughly 5.5% to about $15.01 billion. Because stablecoins serve as the primary capital rail for decentralized trading and liquidity provisioning, this decline often translates into reduced buying power and fewer inflows into SOL trading pairs.
At the same time, SOL has declined roughly 21% from its peak this month and is about 5% lower on the week, underscoring the intensifying downside pressure.
These on-chain changes arrive as macro headlines also weigh on risk assets. Renewed U.S.–China tariff tensions and an ongoing U.S. government shutdown have injected extra uncertainty into global markets, prompting many investors to retreat from higher-risk holdings until clearer signals emerge.
Macro calendar risk: U.S. CPI in focus
Traders are also bracing for the U.S. Consumer Price Index (CPI) release. The delayed report, now scheduled for Oct. 24, is a key input for Federal Reserve decisions and could materially influence crypto market sentiment. A hotter CPI print would likely amplify rate-hike fears and compound selling across cryptocurrencies, while a cooler-than-expected reading could restore some risk appetite and support a rebound in SOL.
Technical picture: bearish crossover and momentum indicators
On the daily chart, Solana’s price action has formed a bearish crossover: the 20-day simple moving average has crossed below the 50-day SMA, signaling weakening short-to-medium-term momentum and increasing the probability of a continued downtrend.
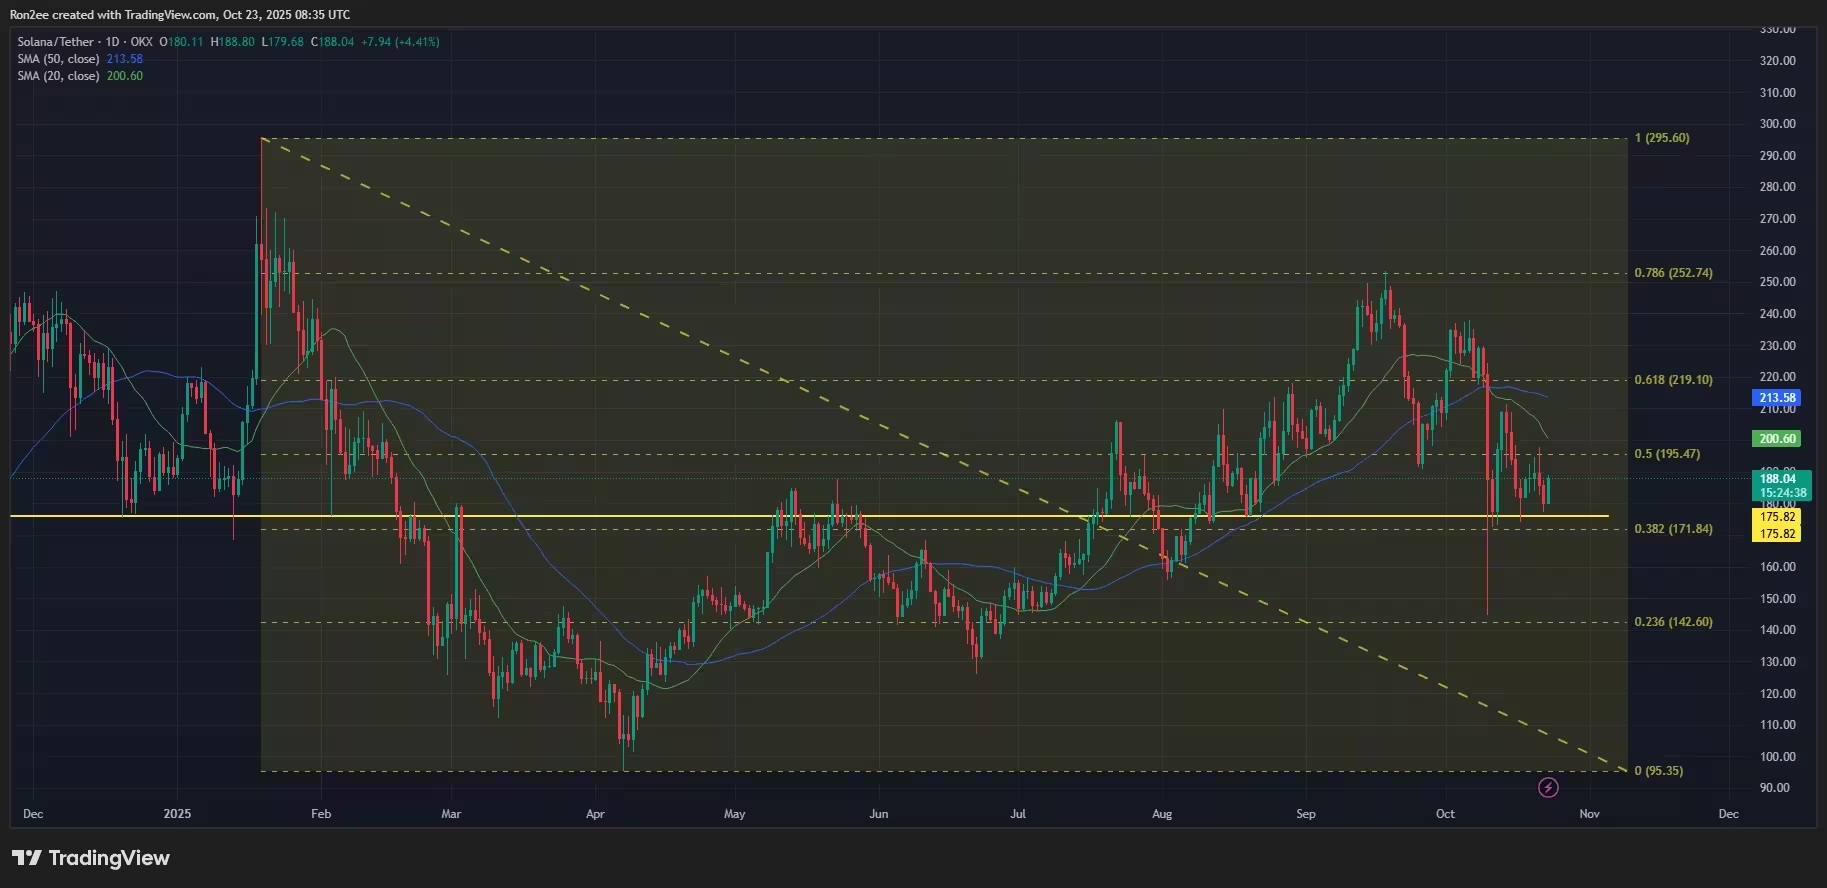
SOL price has formed a bearish crossover on the daily chart
Beyond moving averages, SOL remains trading under the 200-day exponential moving average, a commonly watched trend filter and psychological resistance zone near $200. Other momentum indicators are aligned with the bearish case: the Supertrend has flipped red and the MACD is tracking lower, both pointing toward ongoing selling pressure.
.avif)
Solana Supertrend and MACD chart
Support, resistance, and trade considerations
Immediate support is centered around $175.82, a level that has historically drawn buying interest. If bulls fail to defend that range and price breaks below it, SOL could accelerate toward deeper demand areas near $165 or even $150. Conversely, a sustained recovery above $200 — reinforced by a move back above the 200-day EMA — would be required to shift sentiment and open the possibility of a broader recovery.
For traders, the combination of falling stablecoin supply and bearish technicals argues for caution: consider tighter risk management, reduced directional exposure, or strategies that hedge against downside until stablecoin liquidity and macro clarity improve.
Outlook
In summary, Solana faces a mix of on-chain and macro headwinds. The drop in stablecoin supply reduces immediate liquidity support for SOL, while a bearish moving average crossover and negative momentum indicators reinforce the short-term downside bias. Market reaction to the upcoming U.S. CPI print and any easing of geopolitical tensions will likely be decisive in determining whether SOL finds buyers or continues to test lower support zones.
Source: crypto
Leave a Comment