5 Minutes
HYPE price looks poised for a bullish breakout from a falling wedge pattern as several developments — including a Robinhood listing and a corporate buy-in — have reignited investor interest in the token.
Why HYPE is back in focus
HYPE (Hyperliquid) has climbed about 19% over the past seven days, trading near $40 as of Oct. 24 morning Asian time — up roughly 8.1% on the day but still about 33.6% below its year-to-date high. Renewed momentum stems from multiple fundamental catalysts that could support demand and increase liquidity for the token.
The most visible catalyst was Robinhood's recent decision to list HYPE, which opens the token to a broad U.S. retail audience and typically increases daily on-chain and off-chain trading volumes. On the same day, Hyperliquid Strategies Inc. filed an S-1 registration statement with the U.S. Securities and Exchange Commission to raise up to $1 billion via a stock offering. The filing disclosed plans for some proceeds to be used to acquire and stake HYPE, which signals an intent to accumulate the token and can strengthen medium-term buy-side pressure.
In addition, medical-technology firm ENDRA Life Sciences disclosed a $3 million purchase of HYPE tokens as part of its digital asset treasury strategy, marking another example of institutional or corporate treasury participation that can bolster confidence in the token's utility and adoption.
Technical setup: falling wedge on the 4-hour chart
On the 4-hour timeframe, HYPE has been carving out a falling wedge since early September — a pattern defined by lower highs and lower lows that converge into a narrowing range. In many cases, a breakout above the wedge's upper boundary signals a bullish reversal and can attract fresh buying.
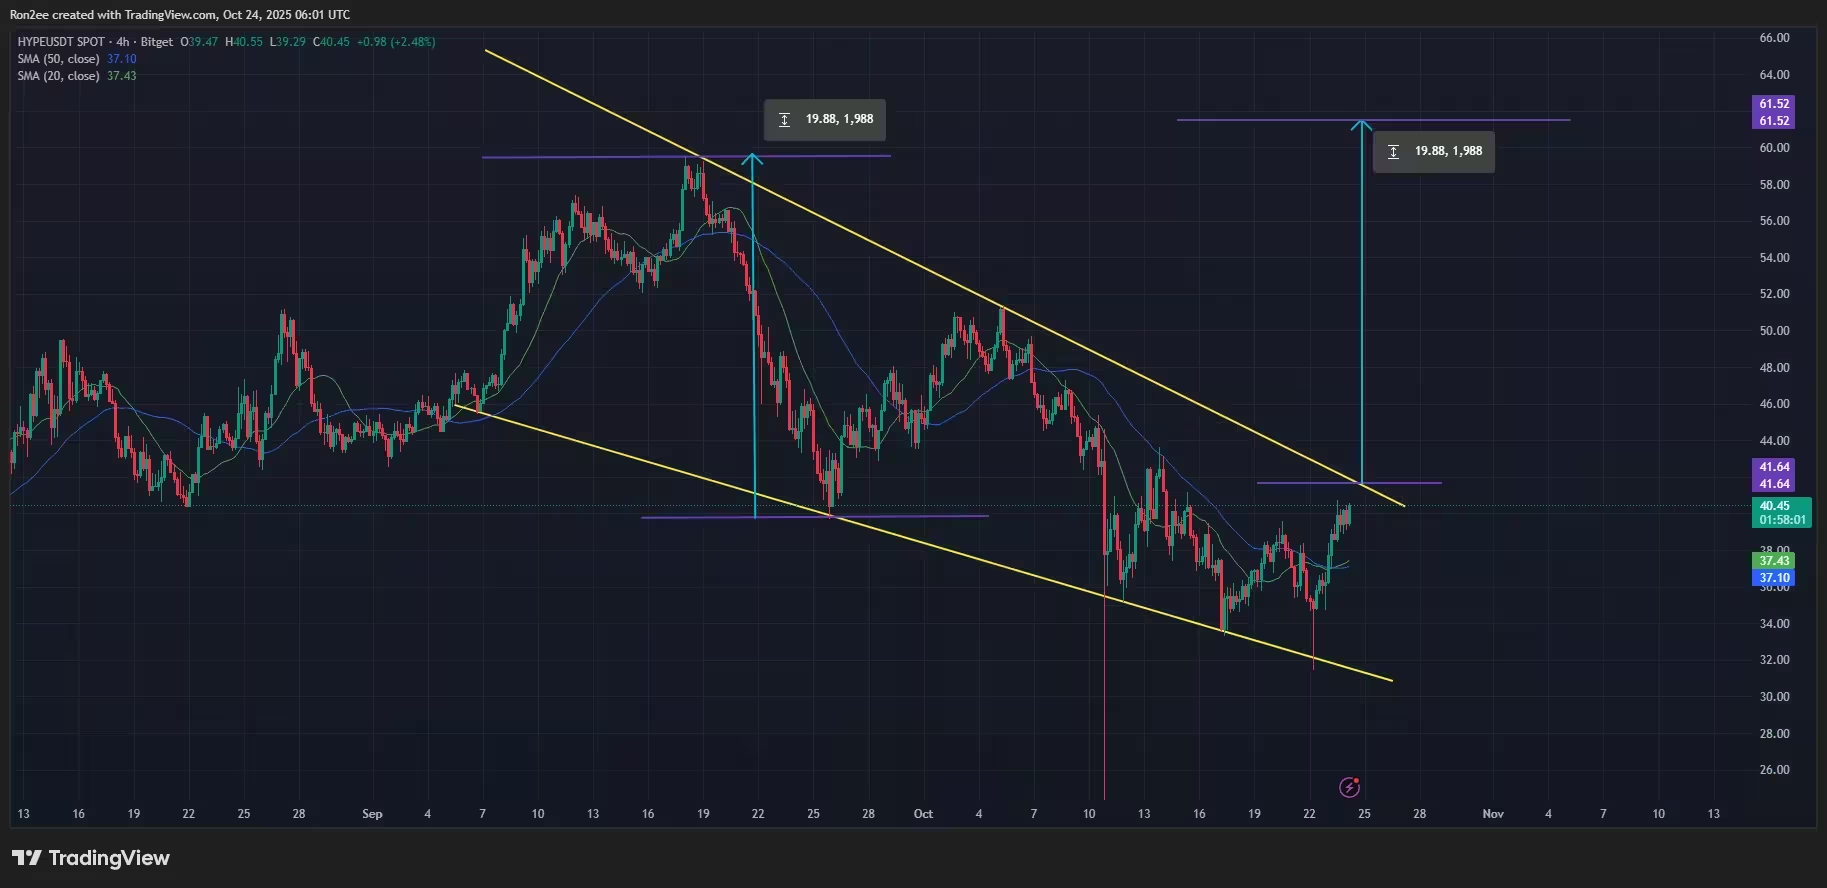
HYPE price eyes a breakout from a bullish reversal pattern on the 4-hour chart — Oct. 24
As of this writing, the token is trading close to the wedge's upper trendline near the $41–$42 zone. A decisive move above that level, confirmed by increased trading volume, could propel the price toward a measured target around $61.50 — approximately 54% above current levels. That target is calculated by taking the wedge's maximum vertical height and projecting it upward from the breakout point, a common method in technical analysis for estimating potential gains.
Momentum indicators and supporting signals
Several technical indicators support the bullish thesis. The Aroon Up reading of 71.4% versus an Aroon Down of 14.29% suggests buyers are gaining control of the shorter-term trend. The Relative Strength Index (RSI) has rebounded above the neutral 50 mark and remains below overbought thresholds, implying there is room for additional upside before exhaustion signals emerge.
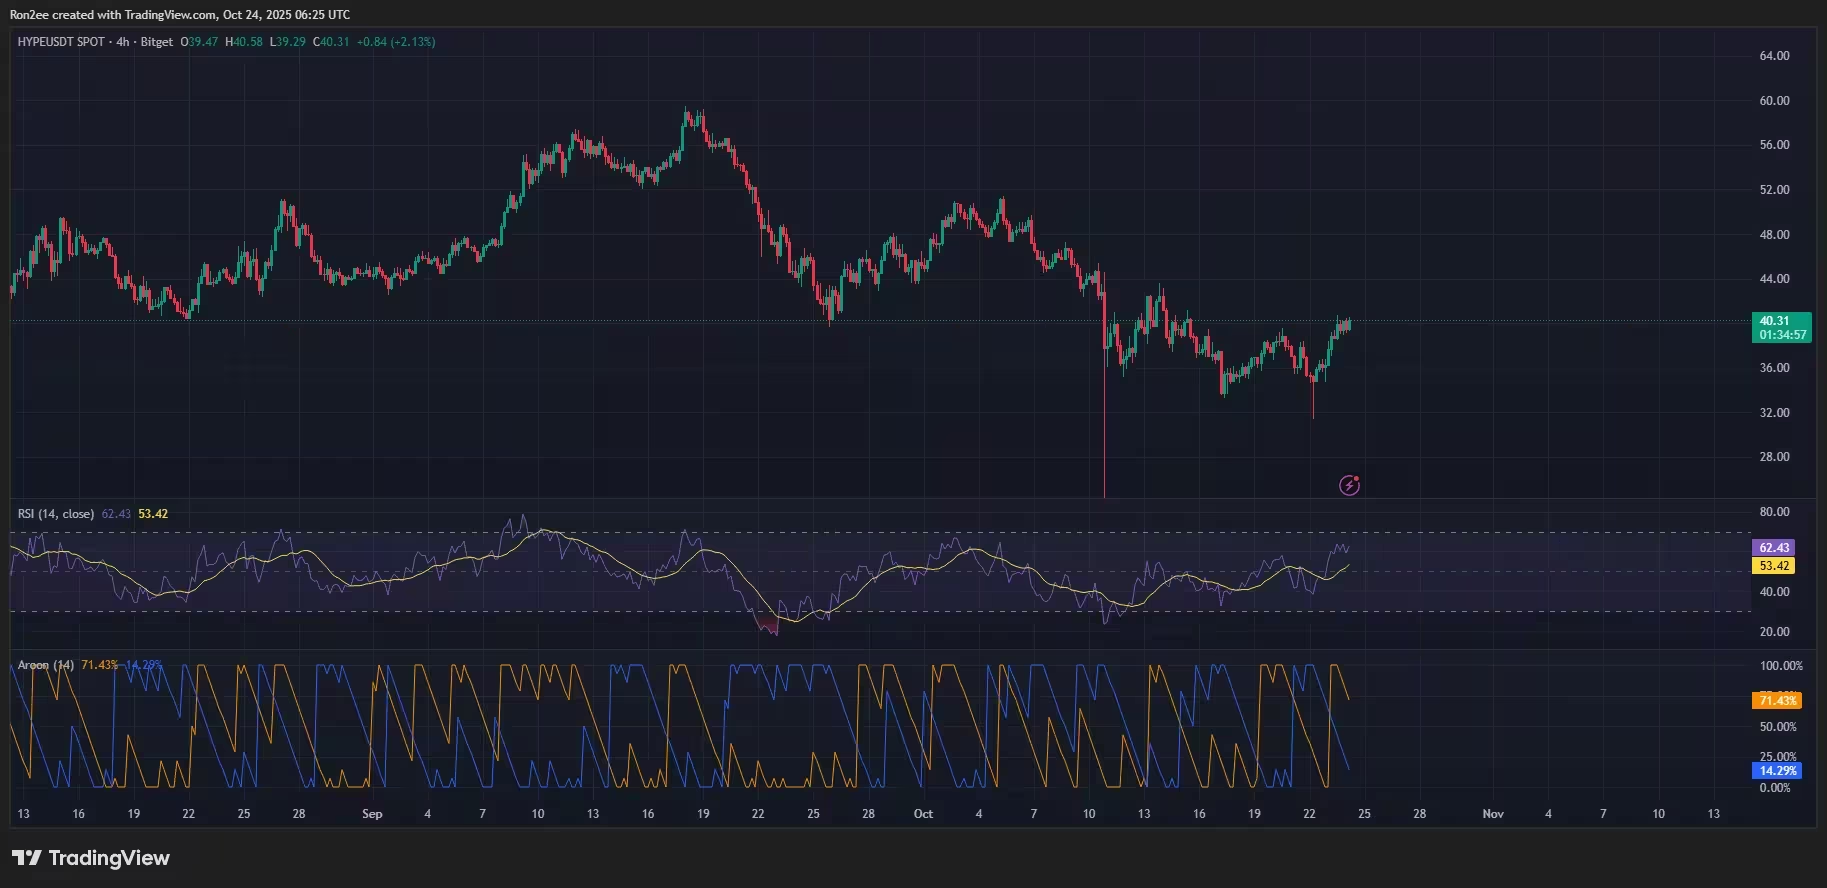
HYPE MACD and RSI chart — Oct. 24
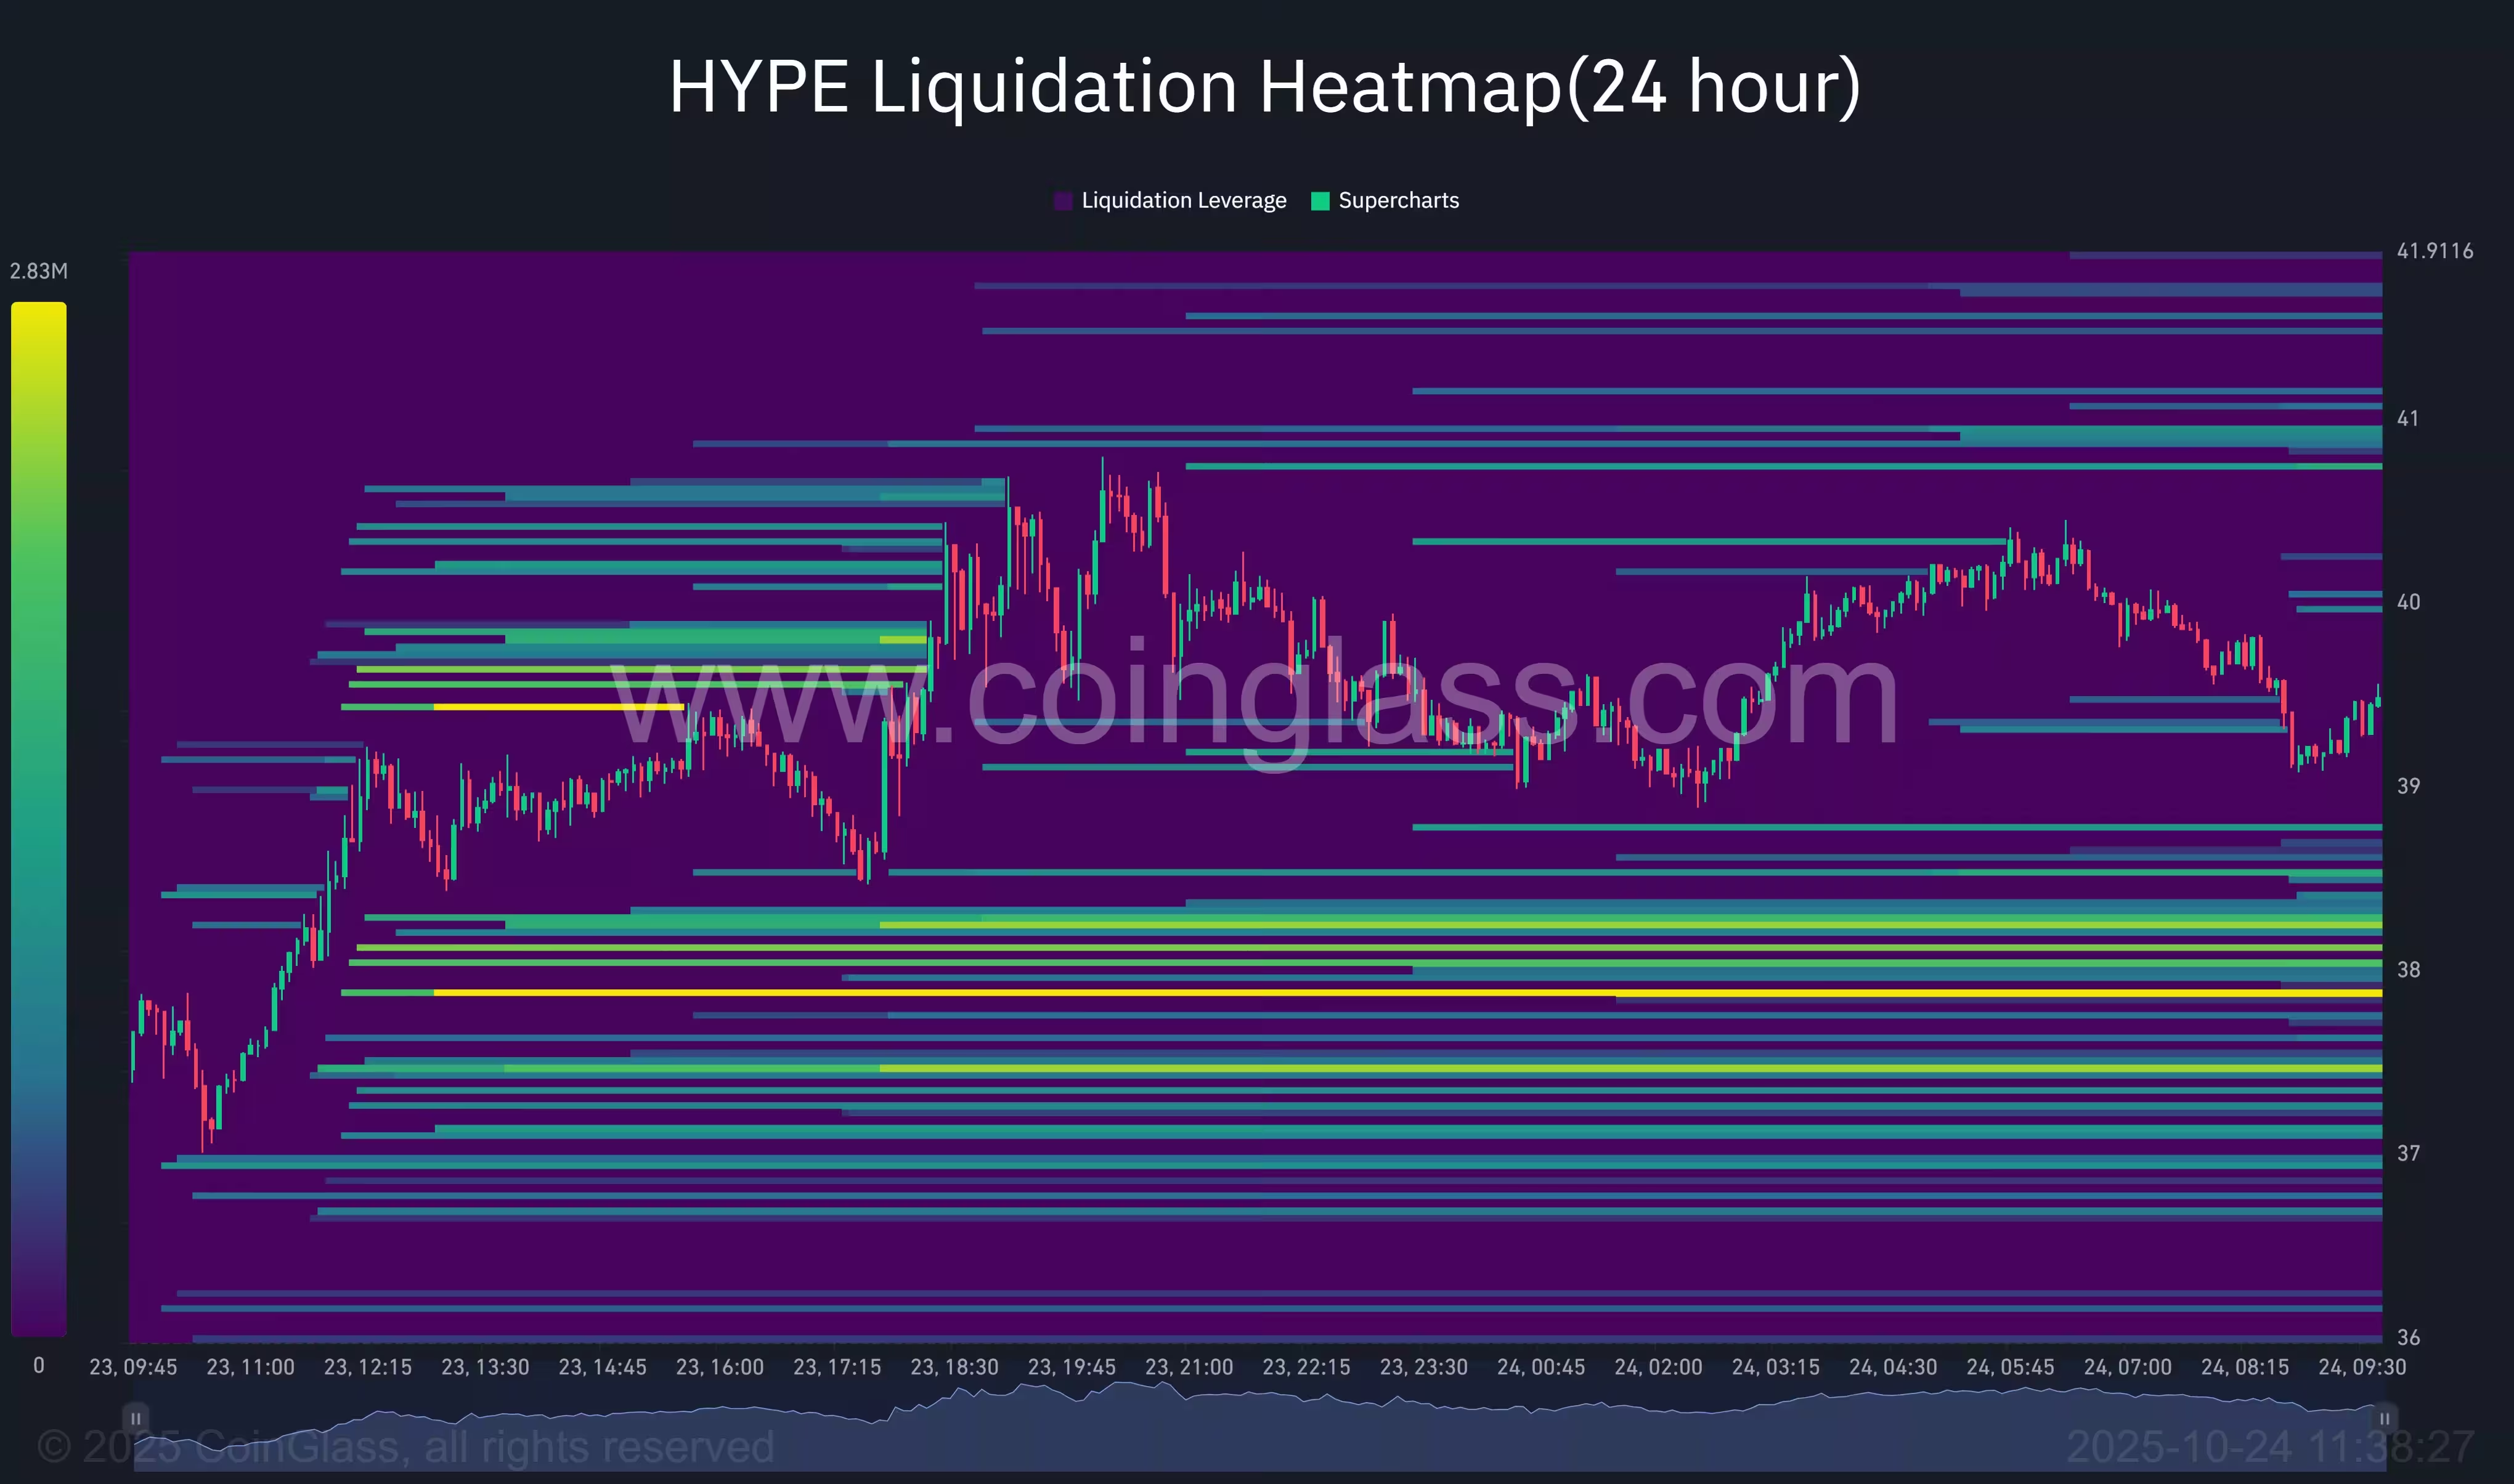
Liquidation clusters that could amplify a breakout
CoinGlass’s 24-hour liquidation heatmap shows a concentration of short-liquidation orders between $41 and $42 — precisely the wedge’s upper boundary. If price closes convincingly above that band, forced liquidations of short positions could fuel a sharp upward impulse as leverage is swept out of the market.
On the downside, a notable cluster of liquidation activity appears between $38 and $36, which could act as a short-term support band where buyers may defend positions. However, a break below $36 could expose thinner liquidity and accelerate downside movements, leaving room for larger intraday swings.
Targets, risk management, and trade considerations
Technical targets and fundamental catalysts align in a way that could support a meaningful HYPE rally, but traders should weigh risk carefully. If a breakout occurs, the first major upside target is the $61.5 level. Conservative traders may prefer to wait for a confirmed daily close above $42 with increased volume, while more active traders might enter on an intraday breakout and use tight stops below the breakout zone to limit downside risk.
Conversely, failing to hold the $36 support could invalidate the bullish setup, increasing the probability of deeper retracement. Market participants should also monitor overall crypto market sentiment, Bitcoin and Ethereum price action, and macro headlines that can quickly reverse momentum.
Key takeaways for traders and investors
- Multiple catalysts — Robinhood listing, S-1 filing from Hyperliquid Strategies, and ENDRA’s purchase — have helped revive interest in HYPE.
- The 4-hour falling wedge pattern suggests a potential bullish reversal if the token breaks above $41–$42 with strong volume.
- Technical indicators (Aroon, RSI, MACD) and CoinGlass liquidation clusters favor a breakout scenario that could lead to a measured target near $61.50 (about +54%).
- Risk management is essential: keep an eye on the $36 support band and liquidity conditions below it.
For traders and long-term investors alike, HYPE’s combination of fresh listings, corporate treasury allocations, and a constructive technical pattern make it a token to watch. Stay disciplined, use clear risk parameters, and monitor volume and liquidation data to confirm any breakout.
Source: crypto
Comments
Tomas
Is this even true? Robinhood listings often pump then fade, corporate buy-ins might be PR. Watch the 36 support, or it could unravel fast.
coinflux
Wow didnt expect Robinhood listing to move it this fast... corporate buy in is big. If vol pops, 61.5 looks doable, but still nervous
Leave a Comment