
5 Minutes
BNB (Binance Coin) has slid sharply over the past week, raising the risk of a confirmed bearish crossover on its daily chart. The token declined roughly 13% in seven days and is trading near critical technical levels that could determine whether the correction remains shallow or evolves into a deeper sell-off.
Price action and market context
BNB fell to an intraday low of $1,027 on Nov. 3, representing a 6% drop in 24 hours and roughly a 13% decline from last week’s highs. Daily trading volume jumped to about $1.8 billion, nearly double previous levels, which, combined with price deterioration, indicates rising selling pressure and potential panic selling by short-term holders.
The broader crypto market also experienced elevated volatility today, driven by waves of short selling and nearly $400 million in liquidations. Traders are repositioning ahead of the U.S. jobs report scheduled for Friday, Nov. 7. A stronger-than-expected jobs print could reinforce the Federal Reserve’s current hawkish stance and weigh on risk-on assets like BNB. Conversely, a softer report might renew hopes for rate cuts and alleviate some selling pressure.
A look at derivatives data adds to the bearish tone. Open interest in BNB futures has dropped sharply from $2.97 billion on Oct. 8 to about $1.56 billion at press time, and the long/short ratio sits below 1. Together these metrics suggest traders are positioning for more downside rather than a quick recovery. The Crypto Fear & Greed Index also reflects caution, with a reading in the ‘fear’ zone at 42 when this analysis was performed.
Technical analysis: patterns, indicators and key levels
On the daily chart, BNB has formed what appears to be a bearish double-bottom pattern, with both lows forming near $1,376 and the neckline around $1,074. Price action has slipped below that neckline, which is commonly interpreted as a confirmation of breakdown and can accelerate downward momentum.
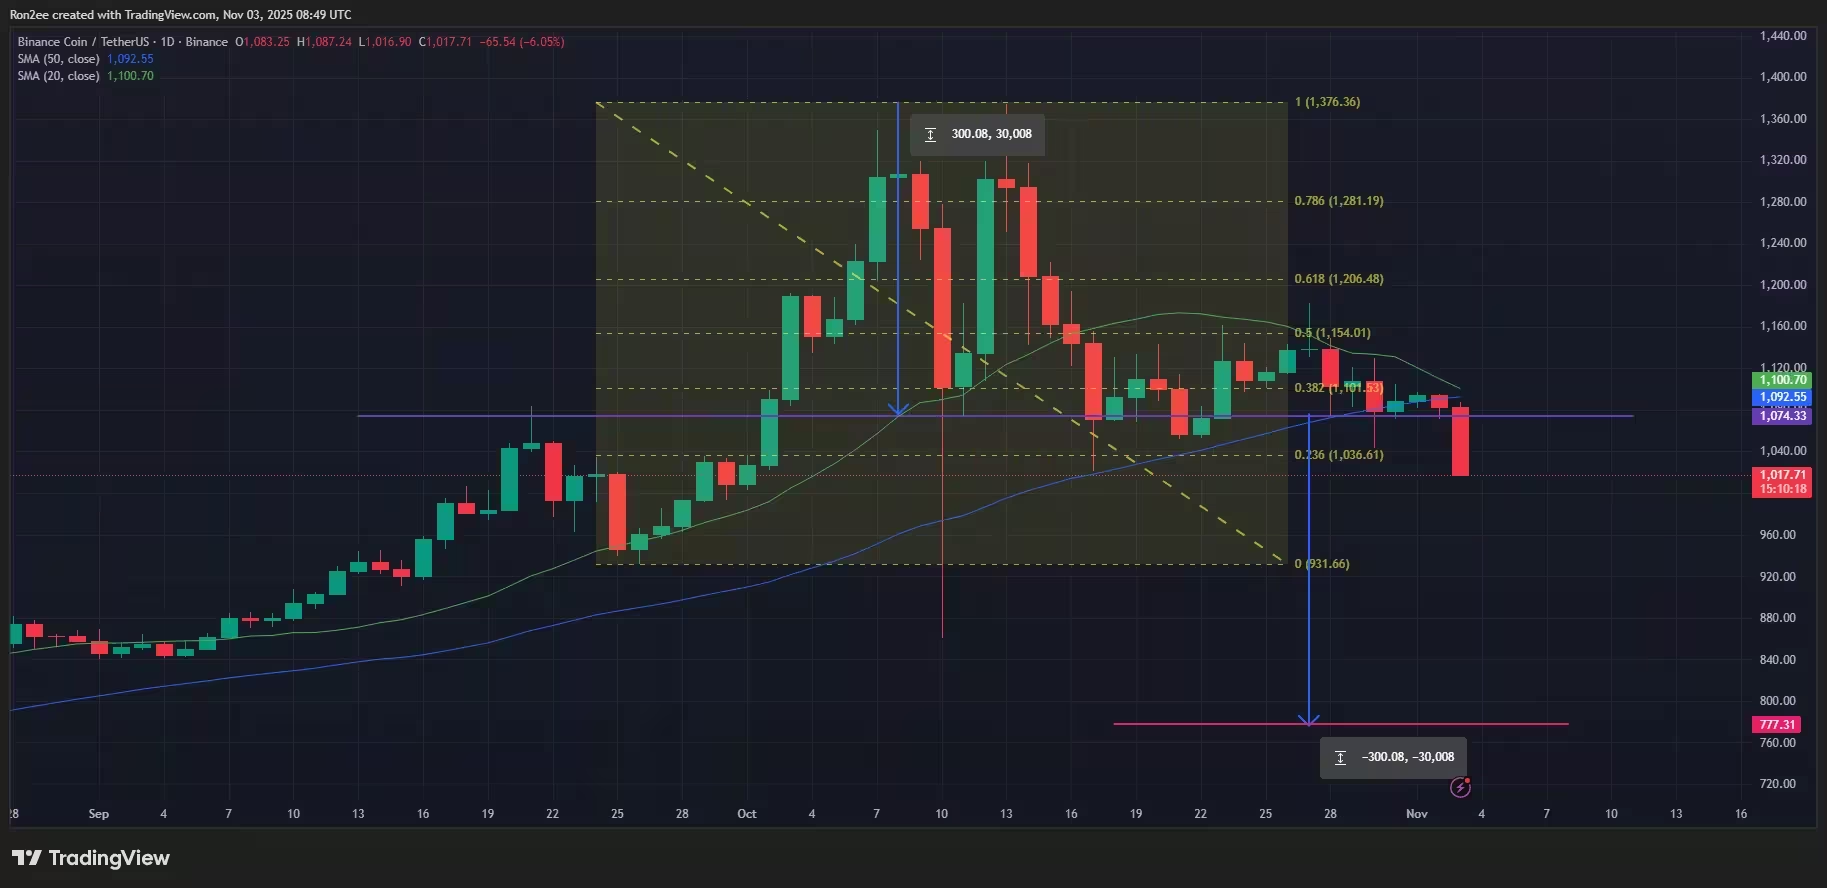
BNB price shows a bearish crossover approaching on the daily chart — Nov. 3
Technical indicators reinforce near-term bearish risk. The 20-day simple moving average (SMA) is poised to cross below the 50-day SMA, a bearish crossover traders often treat as an early warning of extended weakness. The Supertrend indicator has flipped red after crossing above price, signaling a trend shift to the downside. The Relative Strength Index (RSI) is below the neutral 50 level, indicating sellers are currently dominating buying pressure.
.avif)
BNB price, Supertrend, and RSI chart — Nov. 3
Support and resistance targets
Immediate support sits near $931.6 — a level tested during the September pullback and likely to act as the next significant floor. If that level fails, technical projections based on the double-bottom height point to a deeper downside target near $777.3, which is approximately 24% below the current market price at the time of writing.
On the upside, a decisive reclaim of $1,100, which aligns with the 50-day SMA, would invalidate the bearish setup and could open the door for a short-term recovery toward prior highs. Until that level is convincingly breached, the risk-reward profile favors sellers.
What traders should watch
- U.S. jobs data: A strong employment report may reinforce Fed hawkishness and pressure crypto prices, including BNB. A weak report could boost rate-cut expectations and relieve some downside pressure.
- Derivatives flows: Continued declines in open interest and a long/short ratio below 1 suggest the futures market is leaning bearish. A reversal in these metrics would be bullish.
- Volume behavior: If price drops continue on rising volume, it signals conviction among sellers. Conversely, dwindling volume on further declines could hint at exhaustion and a potential bounce.
- Key technical levels: Watch $931.6 for support and $1,100 for an upside invalidation of the bearish case.
Conclusion
BNB’s short-term outlook currently tilts bearish. Chart structure, moving averages, Supertrend, and RSI signal that downside momentum could persist unless buyers step in and push price above the 50-day SMA and the $1,100 threshold. Traders and holders should monitor macro catalysts — notably U.S. jobs data and Fed policy implications — alongside derivatives metrics to gauge whether this correction remains temporary or deepens toward the $777.3 projection.
At press time, BNB was trading around $1,031 per coin.
Source: crypto
Comments
Marius
wow, that 13% in a week is nasty. If jobs print is strong, expect more pain. ugh.
fundflux
Is this even real? BNB dropping fast, but OI fell too, could be washout or bigger seloff. Watching $931.
Leave a Comment