
3 Minutes
Bitcoin fights to retake $95,000 amid rising implied volatility
Bitcoin is attempting to claw back above the key $95,000 resistance after slipping to a local low near $89,000. The pullback from the October all-time high has catalyzed a sharp jump in implied volatility, driving options traders to pay more for downside protection and signaling that market participants expect larger price swings ahead.
Market snapshot: price action and volumes
At the time of writing, BTC was trading around $92,858, up roughly 1.8% for the day but still down about 9% over the past week and 14% month-to-date. From the October 6 peak of $126,080, Bitcoin has retraced nearly 26%.
Spot trading volumes have cooled, with 24-hour spot volume dipping 2.3% to roughly $83.8 billion — a sign that many traders are standing aside for now. Derivatives activity tells a different story: futures volume climbed nearly 15% to $123.2 billion and open interest increased about 3.9% to $67.4 billion, suggesting that participants are hedging positions or augmenting short exposure rather than expecting an immediate rebound.
On-chain indicators point to softer demand
GlassNode’s Nov. 19 report shows Bitcoin trading below short-term holder cost basis and beneath the −1 standard deviation band, which places many recent buyers underwater. That makes the $95,000–$97,000 range a critical resistance band — a sustainable move above it would be the first sign of a regime shift back toward bullish sentiment.
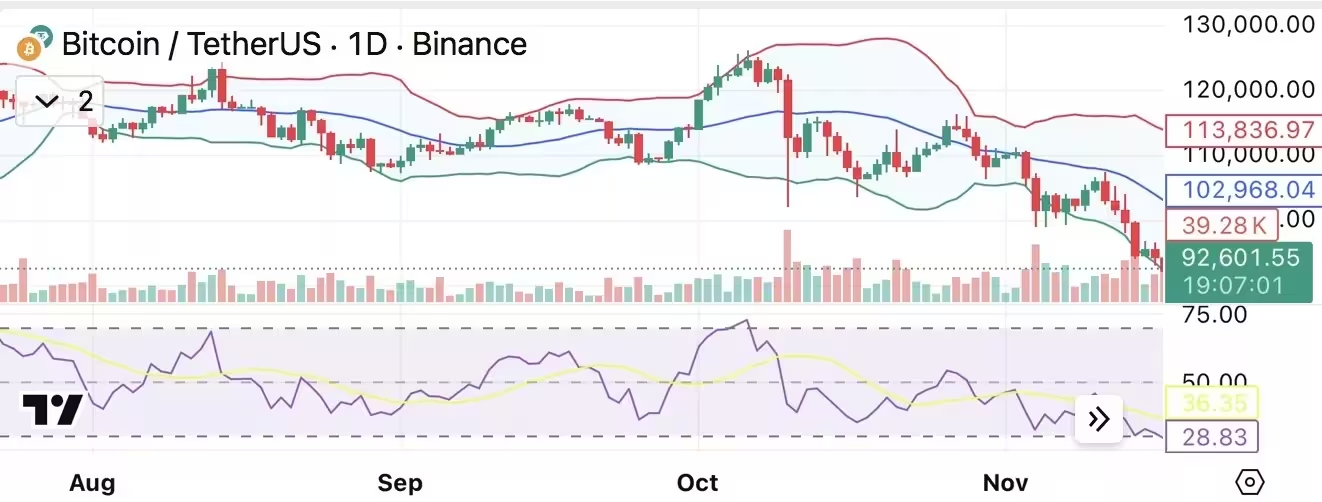
Bitcoin daily chart
The report also highlights a broad-based increase in implied volatility across option maturities and a marked unwind of speculative leverage. Spot ETF outflows and elevated put skew — especially around the $90,000 strike — indicate traders are prioritizing downside hedges. DVOL, the options-derived volatility gauge, is sitting at monthly highs, reinforcing the market’s expectation of larger intraday and multi-day moves.
Realized losses and key supports
Short-term holders are realizing significant losses, with daily realized losses hitting approximately $523 million — their largest since the FTX collapse era. Important on-chain support levels include the Active Investors’ Realised Price near $88,600 and structural support at about $82,000. A decisive break below $82,000 could prompt a deeper bearish leg into the high-$70,000s.
Technical outlook: momentum, indicators and potential bounce
Price currently sits below all major moving averages while the Bollinger Bands have widened, indicating persistent downward pressure as BTC tracks the lower band. The Relative Strength Index (RSI) around 36 shows weak momentum but not extreme oversold conditions.
Some momentum indicators are flashing short-term recovery potential: the Commodity Channel Index (CCI) and Momentum oscillator have turned positive, which could allow a relief rally if implied volatility cools. However, the MACD remains deeply negative and the Average Directional Index (ADX) near 40 confirms the downtrend’s strength.
For sentiment to materially improve, Bitcoin needs to close decisively above $95,000 and preferably $97,000. Failure to reclaim these levels would keep $90,000 as the next likely test, with increased downside risk toward the high-$80,000 area if sellers regain control.
Overall, BTC faces a pivotal period where implied volatility, options flow, futures open interest and on-chain signals will determine whether this episode results in consolidation and recovery or a deeper correction. Traders and investors should watch the $95K–$97K resistance band, monitor DVOL and options skew, and respect the $82K structural support in their risk management plans.


Leave a Comment
Comments
No comments yet. Be the first.