
5 Minutes
What happened to Bitcoin?
Bitcoin (BTC) has experienced one of its sharpest declines in recent months, sliding more than 40% over the past month to reach a year-to-date low near $59,930. The sell-off leaves BTC more than 50% below its October 2025 all-time high around $126,200. Traders, analysts and institutional desks are racing to identify the catalysts behind this sudden drop as volatility returns to the crypto markets.
Key takeaways:
- Multiple market forces — Hong Kong hedge fund leverage, banks hedging ETF-linked products, and miner reallocation — are being cited as drivers of the sell-off.
- Spot ETF activity, options positions and yen funding costs appear central to the narrative.
- If BTC remains below $60,000, miner revenue and production economics could come under material stress.
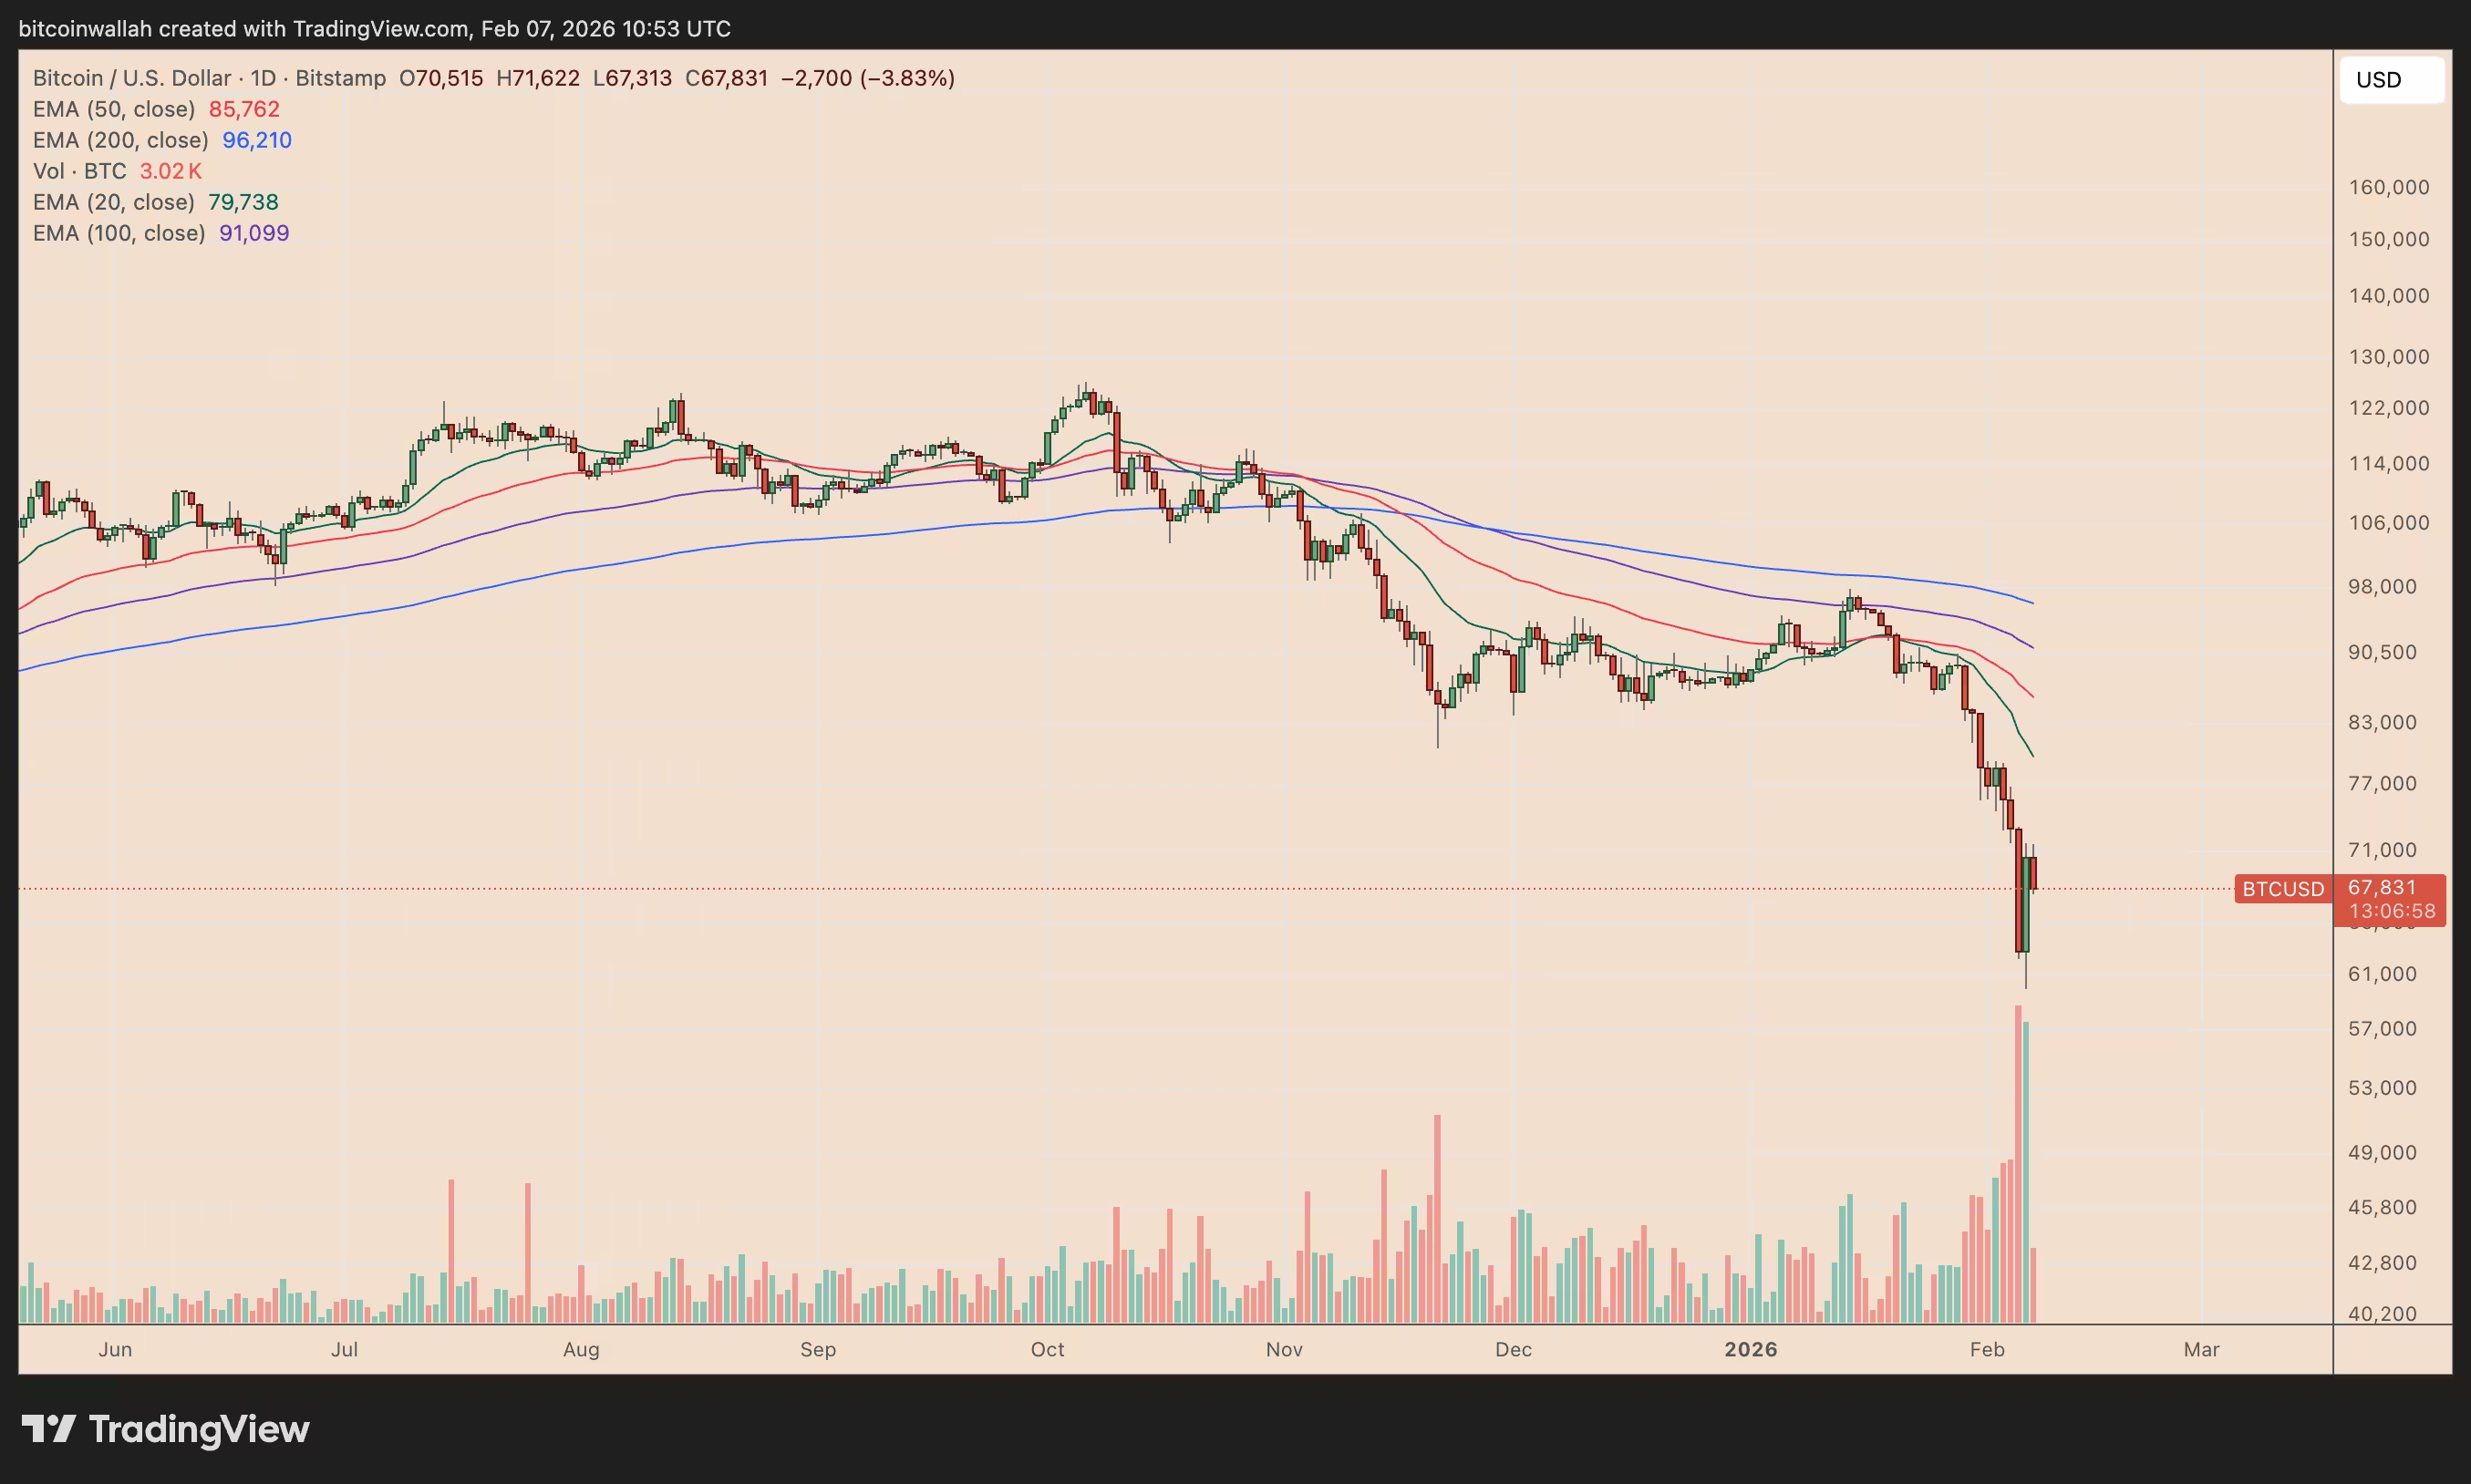
BTC/USD daily price chart.
Theory 1 — Hong Kong hedge funds’ leveraged ETF bets
One widely discussed explanation points to Asia-based hedge funds, particularly in Hong Kong, that placed large, highly leveraged bullish bets on Bitcoin’s continued rise. These funds reportedly used options tied to spot Bitcoin ETFs, such as BlackRock’s IBIT, to amplify returns. To fund those option premiums they borrowed cheap Japanese yen and then converted the proceeds into higher-yielding assets, including crypto.
When the market stopped cooperating and BTC stalled, the carry trade flipped. Rising borrowing costs for yen and margin calls forced rapid deleveraging. Lenders demanded additional collateral and funds were compelled to liquidate positions, creating a waterfall effect that pushed prices down further and amplified panic selling across correlated tokens.
Theory 2 — Banks and ETF-linked structured products
How structured notes can turn dealers into sellers. A second narrative, advanced by former exchange executives and market commentators, focuses on banks that sell structured notes to clients referencing spot Bitcoin ETFs. These products can include barriers, principal protection triggers, or payoff features that force banks to hedge their exposure by trading the underlying — either spot BTC or derivatives.
When key price thresholds are broken, dealers must delta-hedge aggressively. That creates so-called negative gamma: as BTC drops, hedges require more selling, which in turn pushes the price lower and triggers further hedging. Some analysts have pointed to a specific structured note tied to IBIT where breaches around certain levels compelled market makers to reduce risk by selling. These dealer-driven hedges can convert liquidity providers into forced sellers, accelerating the downturn.
Theory 3 — Miners shifting capital to AI data centers
Mining economics and the pivot to AI
A third, more structural factor is a potential reallocation of miner capital from Bitcoin mining to emerging opportunities in AI data centers. Several public miners have reported plans to diversify into broader data center services — a shift that can involve selling BTC reserves to fund equipment and infrastructure.
Market observers have noted hash-rate declines in some regions — estimates suggest drops in the 10–40% range for specific networks or operators — and indicators like Hash Ribbons have signaled stress: the 30-day average hash rate slipping below the 60-day average is historically a negative sign for miner health and may foreshadow capitulation.
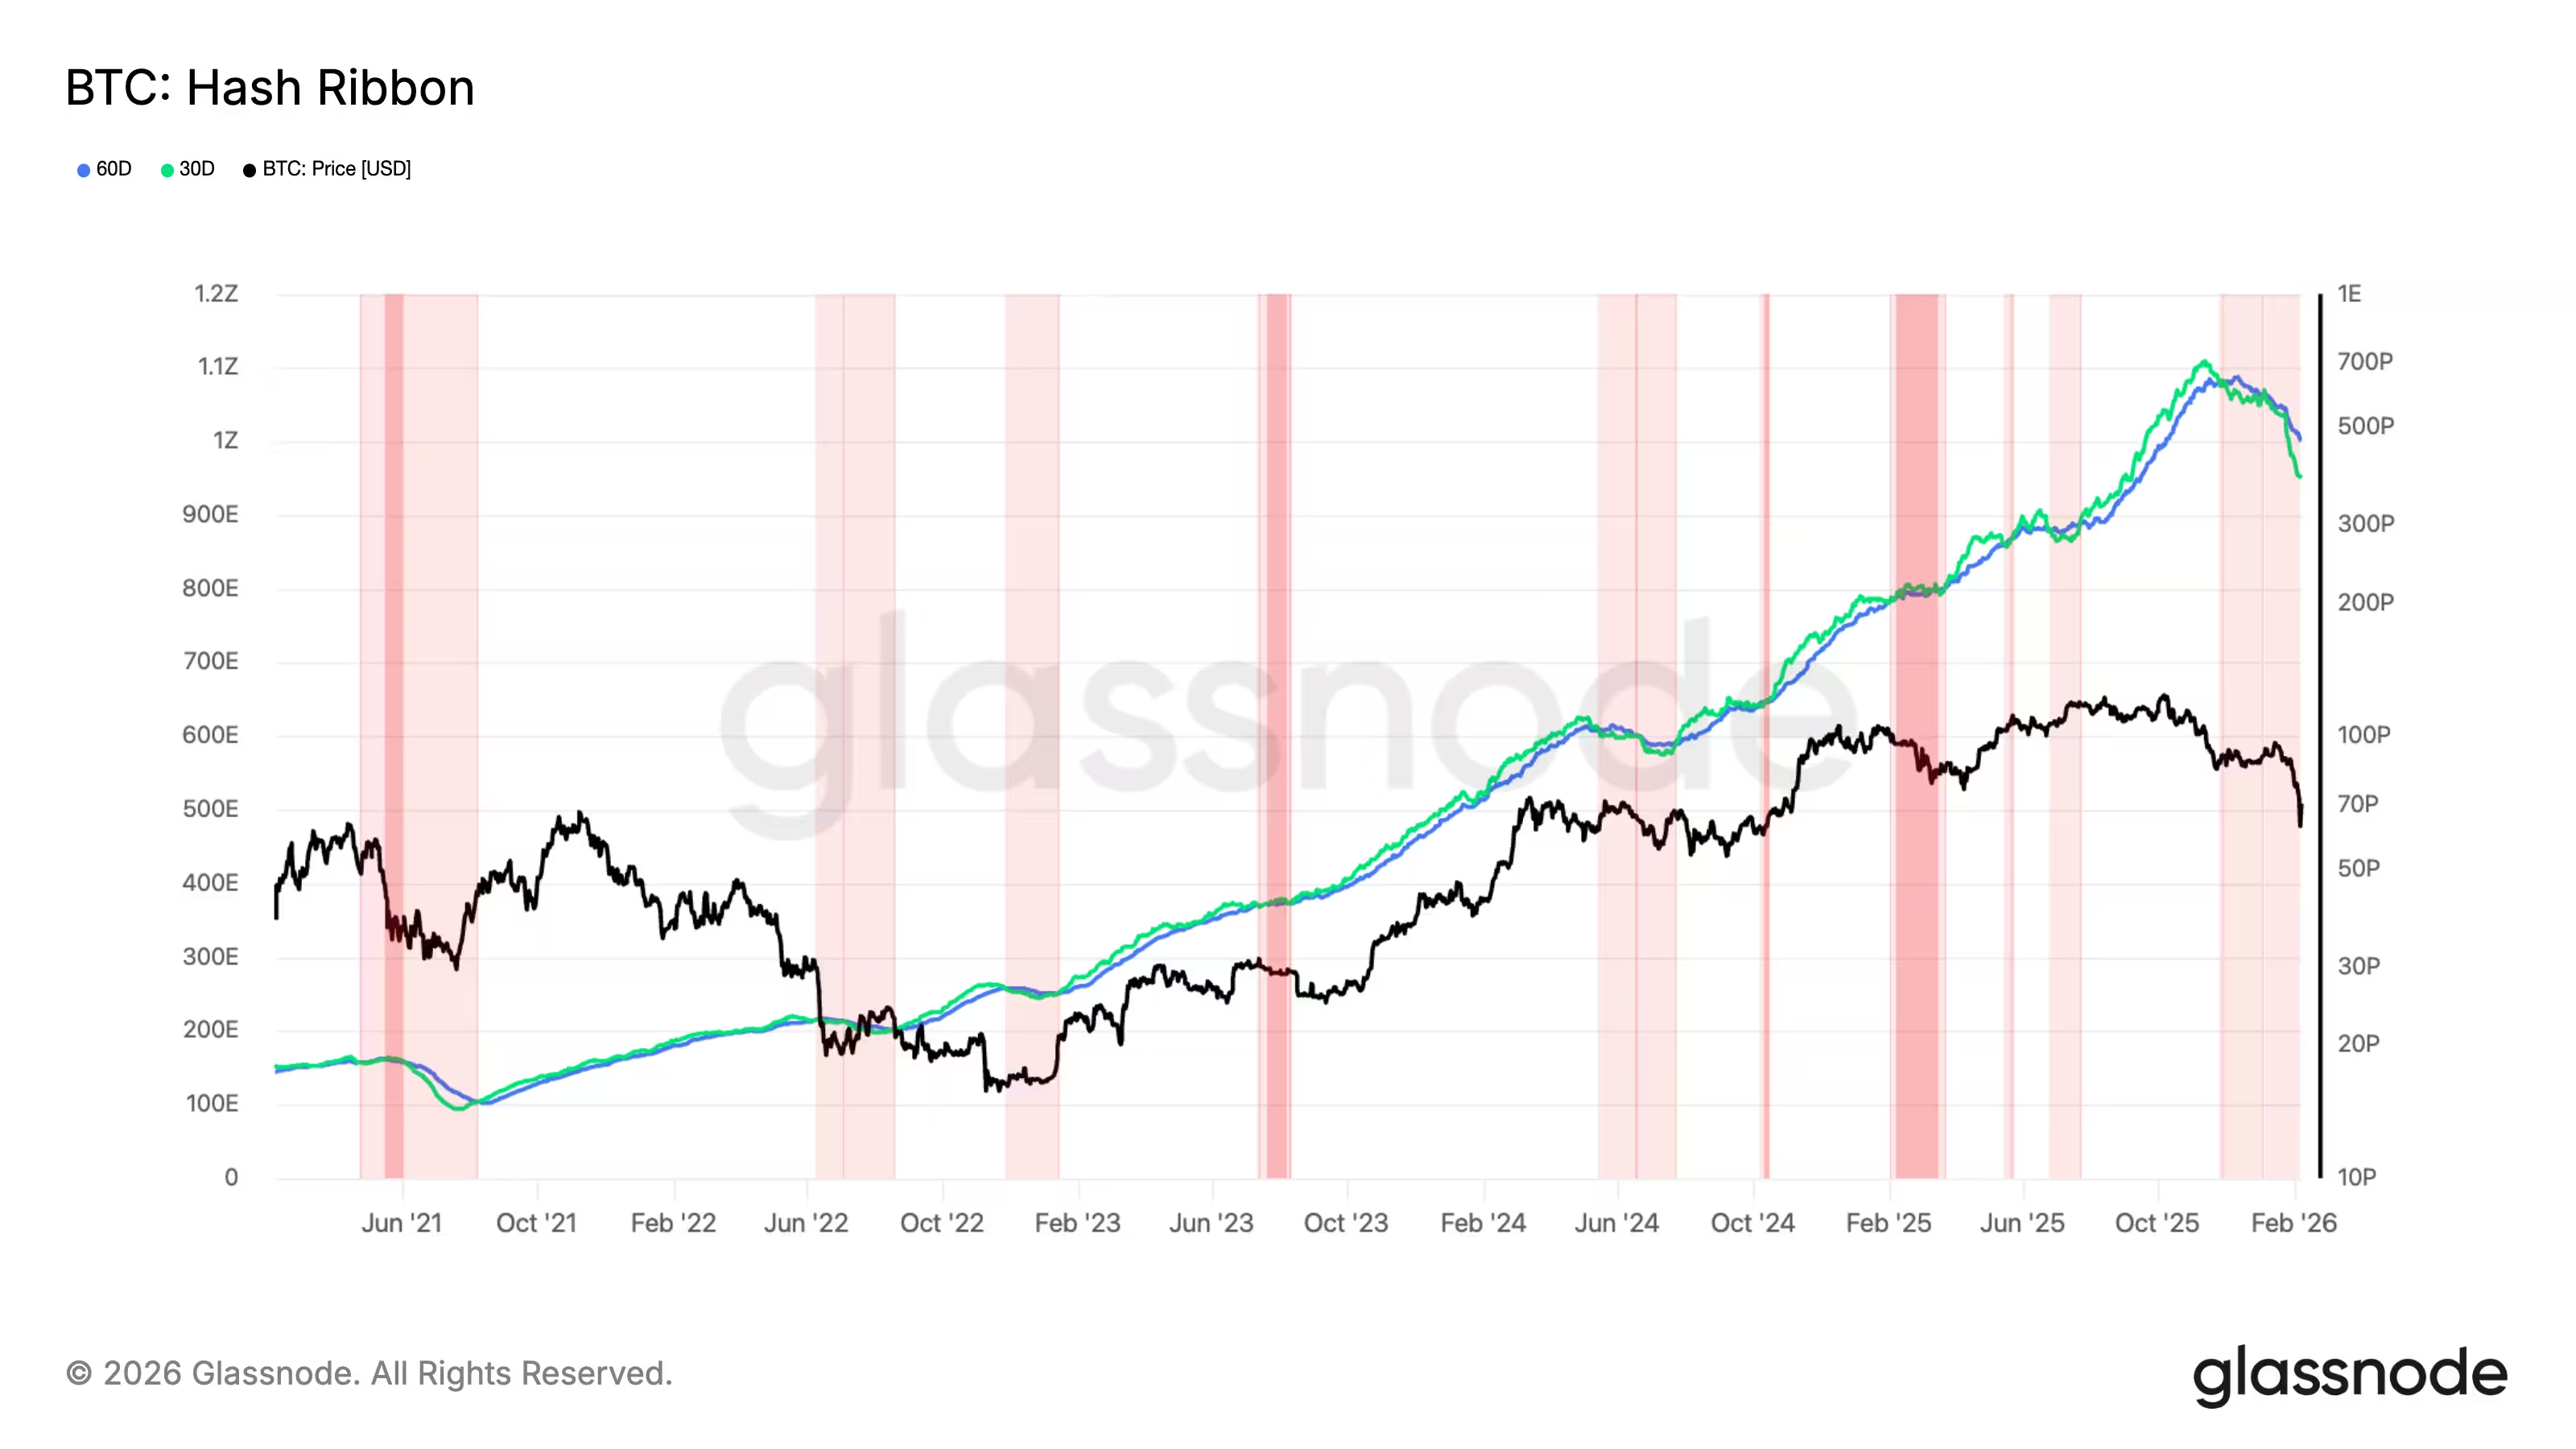
BTC Hash Riboon vs. price.
Data published by research desks shows the estimated average electricity cost to mine one BTC at roughly $58,160, with net production costs closer to $72,700. Given those economics, sustained prices below $60,000 would materially compress miner margins and could trigger further reserve sales if firms need liquidity to cover operations or investments in new data center projects.
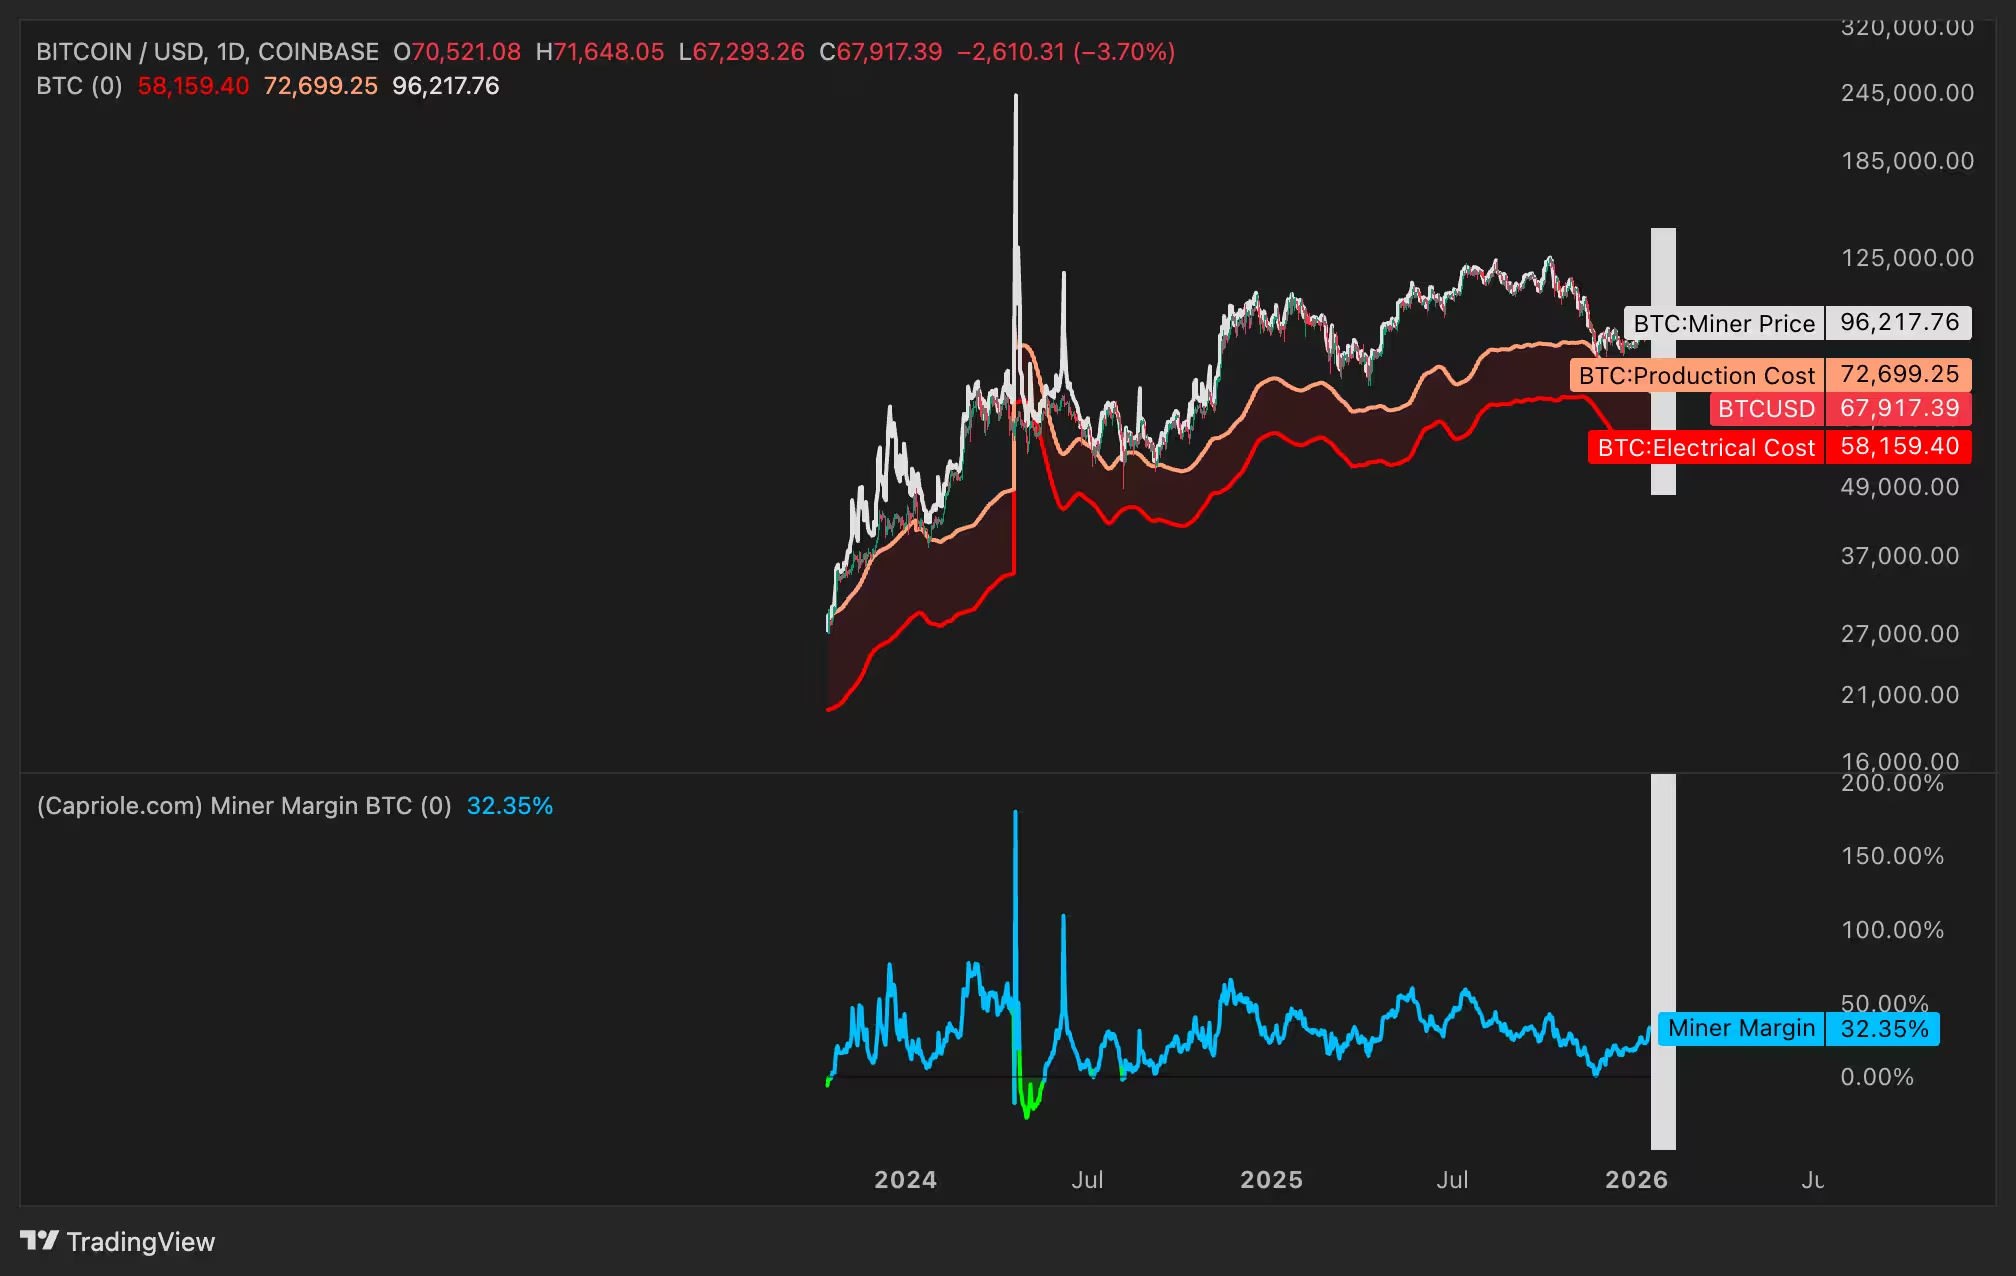
BTC/USD daily chart vs. production and electrical cost.
What this means for traders and long-term holders
Short-term, heightened volatility and liquidity-driven selling can push BTC toward levels that test miner break-even points and dealer hedging thresholds. Long-term holders also appear to be more cautious: on-chain data show wallets holding 10–10,000 BTC control their smallest share of supply in nine months, suggesting some trimming of exposure rather than accumulation.
From an asset-allocation and risk management perspective, market participants should monitor options flows, ETF volumes, funding rates and hash-rate indicators closely. Each of these lenses helps reveal whether selling pressure is primarily liquidity-driven, structurally induced by hedging mechanics, or rooted in fundamental shifts among miners and institutional allocators.
Bottom line
There is likely no single cause; instead this correction appears to be the result of overlapping stresses: leveraged ETF-linked positions unwinding, dealer hedges linked to structured products, and miner rebalancing amid new data center initiatives. If BTC falls decisively below $60,000, expect increased miner pressure and potentially more forced selling, which could deepen short-term downside before the market finds a new equilibrium.
Source: cointelegraph
Comments
Tomas
Pretty balanced take, looks like multiple forces. Watch options flows, hash ribbons and funding rates. If 60k breaks then brace for more selling
arkflow
If miners selling BTC to fund AI is real then wow… but is the HK leverage story overplayed? yen carry + forced hedges sounds messy, curious where this ends
Leave a Comment