

Solana price dips under $120 as sellers gain momentum
Solana (SOL) weakened below the $120 mark after its upward run stalled near $125, pushing attention to the critical $117 support zone. After peaking at $124.62 on Sept. 27, SOL retraced to trade around $117.50 on Sept. 29, a pullback that highlights an immediate battle between bulls and bears in the crypto market.
Key takeaways
- SOL failed to sustain gains near $125 and has pulled back from a recent high of $124.62.
- The token slipped beneath the indicator level of $118.75 on the daily chart and faces selling pressure on the 4-hour timeframe.
- Immediate support around $117 is the next technical test. A breakdown could expose $116.32 and then $112.50 as lower targets.
- Regaining $120.29 would reopen the path toward the $124–$125 resistance band.
Recent price action and market context
SOL began the week trading near $115 before rallying toward $125, but the advance lost steam when the token repeatedly met resistance. The retracement accelerated after price moved back below $120, a level that had briefly acted as support during the rally. On CoinGecko, SOL was reported near $117.85, showing a modest 24-hour decline as leveraged positions and short-term traders reassess risk.
The recent move comes after a stronger leg higher from mid-September, when SOL bounced off the mid-$90s — roughly $97 — and climbed toward the $125 area. Although SOL is still comfortably above those earlier lows, the drop from $124.62 to around $117.50 places the latest rally under pressure and raises questions about near-term trend sustainability.
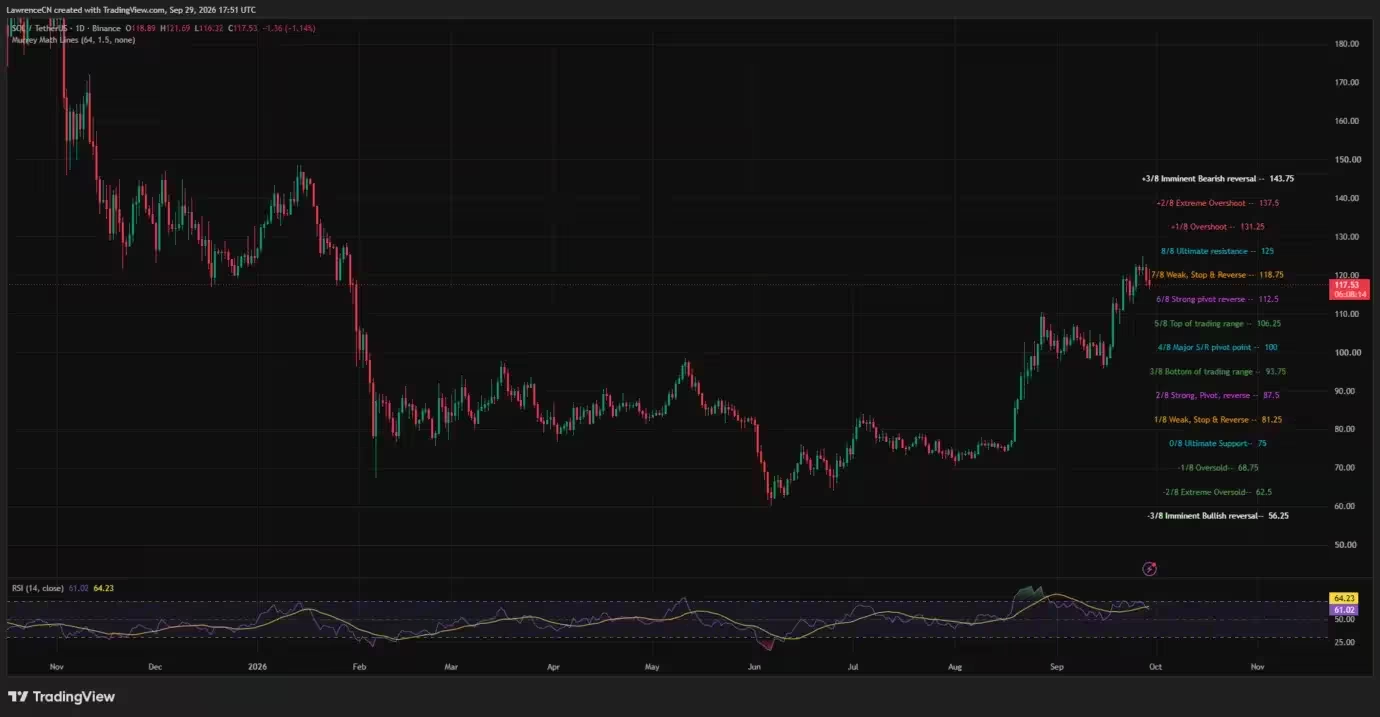
Solana price daily chart — Sep. 29
What the technical indicators are showing
Technically, the daily and shorter-term charts offer contrasting signals. On the daily timeframe, the 14-day relative strength index (RSI) stands near 61, down from recent highs and below its short-term moving average near 64. That suggests that while the broader momentum remains bullish (RSI above 50), the pace of the advance has slowed.
On the 4-hour chart, the picture is more bearish. SOL is trading below the Bollinger Bands’ middle line at $120.29 and has moved close to the lower band near $116.32. The Chaikin Money Flow (CMF) indicator has dropped to about −0.15 on the 4-hour timeframe, reflecting increased selling pressure and money flowing out of the asset during this shorter measurement window.
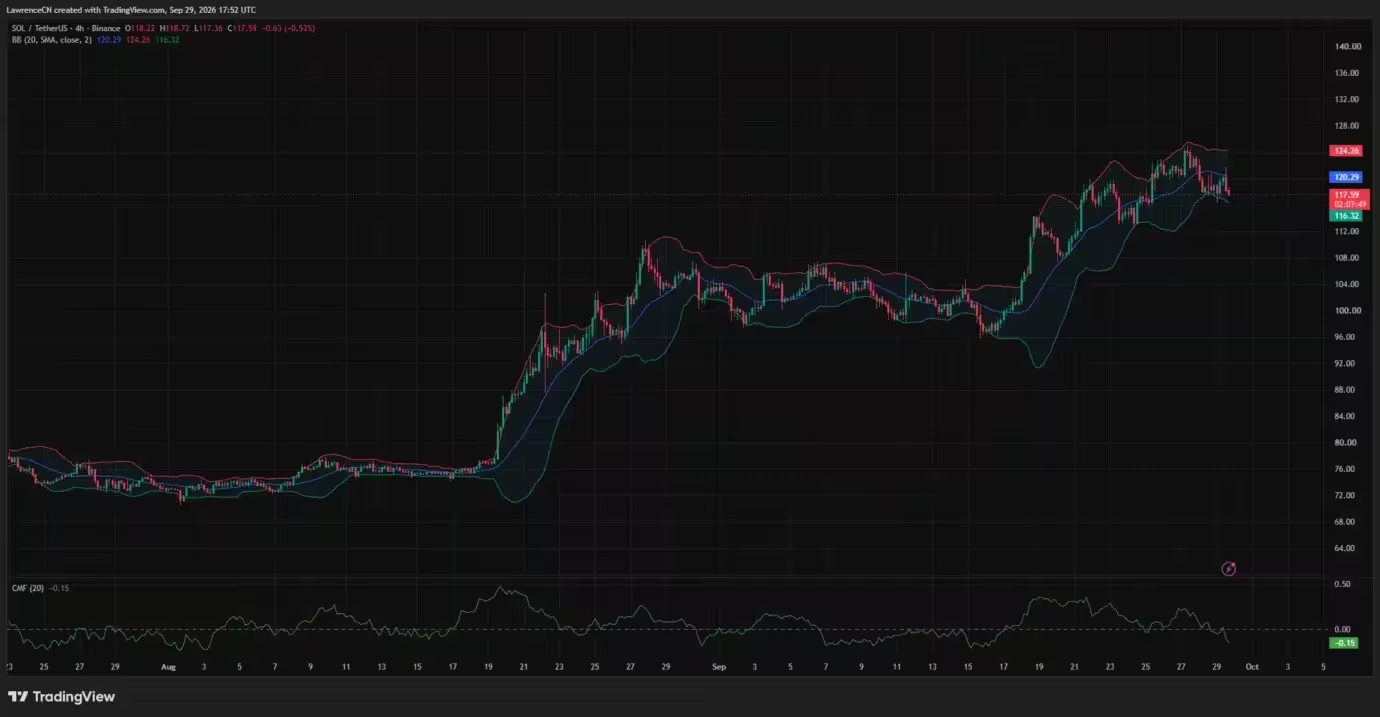
Solana price 4-hour chart — Sep. 29
A decisive close below the lower 4-hour Bollinger Band would likely put the daily support level at $112.50 in focus for traders and investors. Conversely, if buyers can reclaim $118.75 and push through the 4-hour middle band at $120.29, the short-term momentum could swing back in favor of bulls and put renewed pressure on resistance levels around $124–$125.
Analyst perspectives and on-chain implications

Analysts are split on the near-term outlook, largely depending on SOL’s ability to defend the $117 area. Some traders, like Daan Crypto Trades, had identified $117 as a pivotal support that, if held, could keep a longer-term bullish setup intact — even suggesting a potential target as high as $148 if the structure remains intact.
Others, including prominent chartists referred to in market commentary, point to a break below a rising trendline and warn that the token must reclaim both the trendline and nearby support to restore the earlier bull thesis. Failure to do so could trigger another rejection at resistance on any attempted recovery.
Those diverging views underline the importance of the current price band: a hold above $117 would favor the more optimistic scenarios, while a confirmed break beneath that level could validate the bearish perspective and open the door to deeper retracement.
Liquidation map and leverage dynamics
On-chain liquidation maps and order-book heatmaps show clusters of leveraged positions in and around current prices, placing additional emphasis on the $117 area. CoinGlass’ three-day liquidation heatmap highlights concentrations of estimated liquidations near $117, with further bands of leverage stacked around $121–$123 and $125–$126.
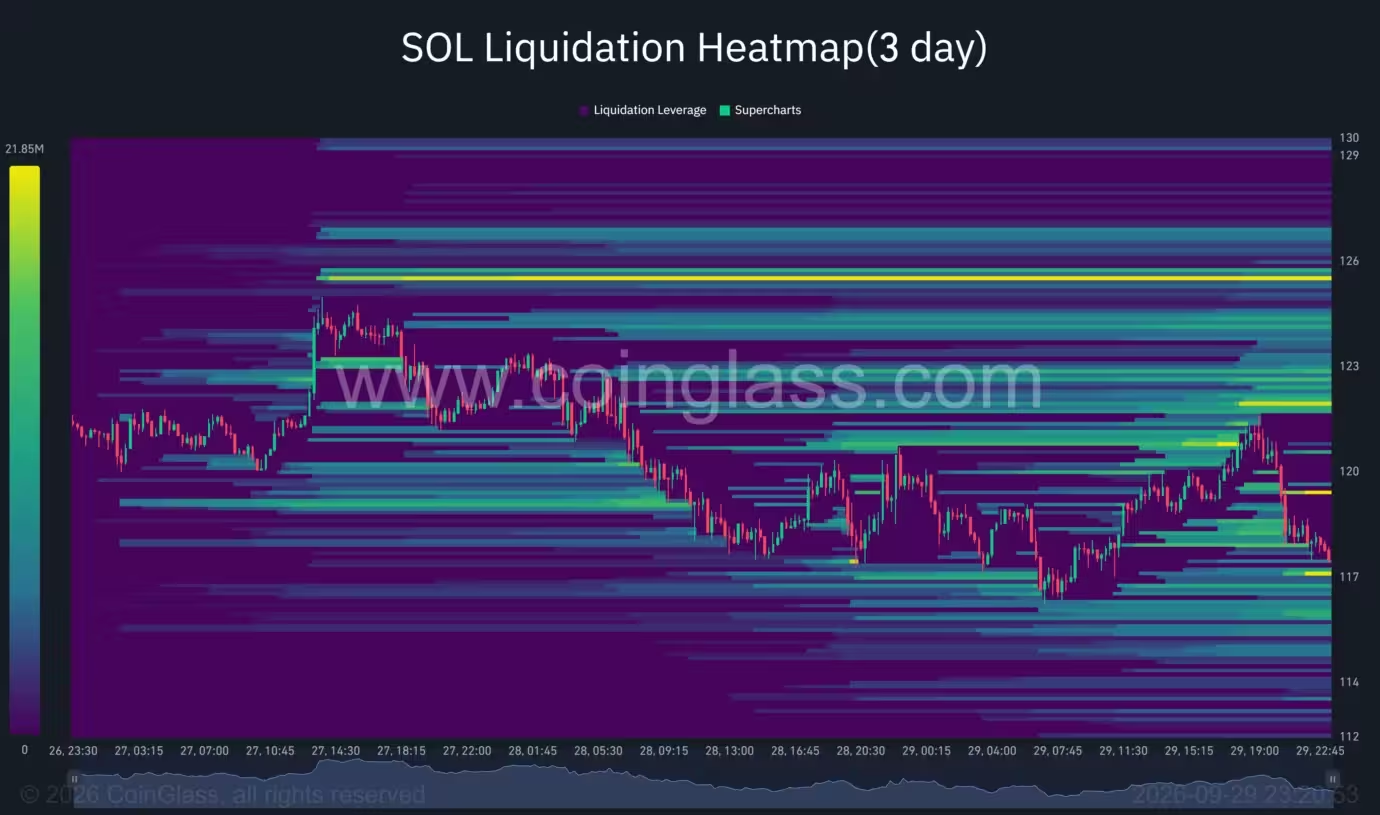
Solana liquidation heatmap
These heatmap bands do not predict price direction, but they reveal areas where forced liquidations could accelerate volatility if SOL moves into those zones. At present, the market trace on the map shows a move back toward $117 after a brief push above $120 on Sept. 29. A cascade of stop-outs near $117 would increase downside momentum, while a clean hold could leave the pullback contained.
What traders will watch next
Short-term traders and derivatives desks will be watching several levels closely:
- Immediate support: $117 — the critical level that will indicate whether the pullback is limited.
- Short-term floors: $116.32 (4-hour lower Bollinger Band) and $112.50 (daily support) if selling intensifies.
- Near-term resistance: $118.75 and $120.29 (4-hour middle band).
- Major resistance: the $124–$125 band, which capped the recent rally.
Momentum indicators like the RSI and CMF offer complementary perspectives: the daily RSI still points to underlying bullish bias above 50, while the negative CMF on the 4-hour suggests sellers currently have the edge in the shorter term.
Conclusion: Is $117 a make-or-break level for SOL?
For now, the $117 zone represents the focal point for Solana’s near-term direction. If buyers defend this level, the setup remains favorable for another attempt on the $124–$125 resistance and potentially higher targets favored by some analysts. If $117 cracks and leveraged positions accelerate losses, traders will be watching $116.32 and then $112.50 as potential downside objectives.
As always, participants should combine technical analysis with risk management — monitoring liquidation clusters, momentum indicators, and on-chain flows — to navigate volatile moves in SOL and the broader crypto market.

Leave a Comment
Comments
No comments yet. Be the first.