
Zcash retraces after a strong September surge
Zcash (ZEC) has pulled back toward the $1,400 region after recently losing the $1,500 support level, testing traders' conviction following a robust September rally. At the time of this report, market trackers show ZEC trading near $1,412, down roughly 0.4% over 24 hours and about 12% over seven days, with a market capitalization near $24 billion and 24-hour volume around $1.31 billion. Despite the short-term decline, ZEC remains significantly higher month-over-month, reflecting a much larger advance that unfolded through September.
Key market snapshot
- Price: around $1,412 (CoinGecko snapshot at research time)
- 24h change: -0.4%
- 7d change: -12%
- 30d performance: roughly +70% despite the pullback
- Market cap: ~ $24 billion
- 24h volume: ~ $1.31 billion
Technical picture: momentum cooled but not broken
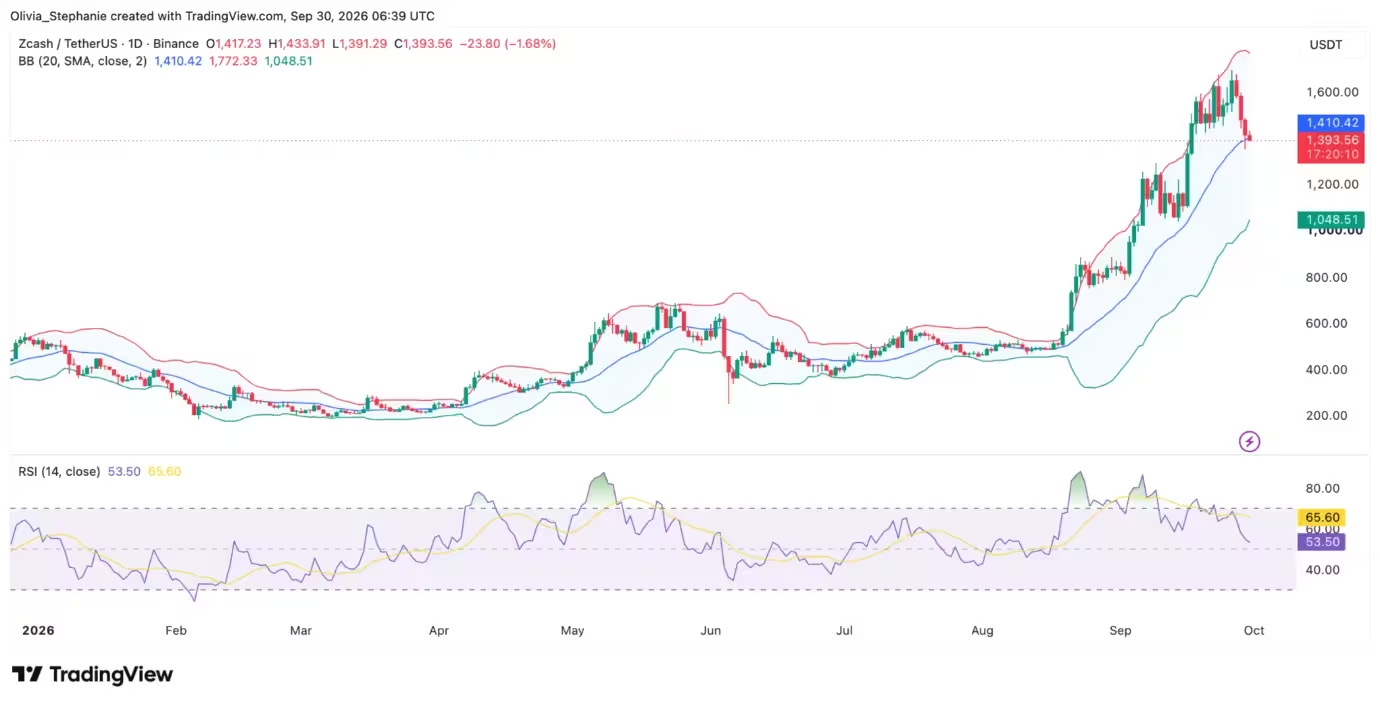
On the daily chart, ZEC slipped slightly below its 20-day middle Bollinger Band, which sits near $1,410.33. The upper band is around $1,772.26 and the lower band close to $1,048.41. Trading beneath the middle band signals softer short-term momentum after the rapid climb in September. A reclaim of roughly $1,410 would put ZEC back above this middle Bollinger reference, while $1,500 remains the immediate psychological barrier and prior support that sellers recently overcame.
Momentum indicators have cooled from overbought territory. The 14-day Relative Strength Index (RSI) is near 53.41, down steeply from September highs; its RSI moving average remains higher at about 65.60. An RSI above 50 suggests the asset is not in oversold territory, but the drop toward neutral indicates waning buying pressure compared with the peak of the rally.
Zcash (ZEC) price chart
Traders are therefore watching price action between roughly $1,390 and $1,410 as the first technical zone to monitor. If this area fails to hold, lower support references come into play, beginning with a near-term intraday floor around $1,360 and then more significant horizontal support zones identified by analysts.
Critical support levels and analyst views
Crypto analyst Alpha Crypto Signal flagged a lower horizontal range between $1,170 and $1,210 as a potential long-interest zone if the pullback continues. The analyst emphasized that any long entry would require bullish confirmation once that zone is reached, characterizing it as a potential reaction area rather than a guaranteed bounce point.
Historically, liquidity for ZEC was concentrated below roughly $1,170 during earlier price structure formation, and the market saw concentrated buying during the breakout above $1,300 in mid-September. From a risk-management perspective, a decline into the $1,170–$1,210 band would represent a deeper retracement from September highs, while a sustained move back above $1,500 would restore the levels lost during the most recent sell-off and reopen upside toward the $1,600–$1,700 resistance cluster.
Intraday floors and downside scenarios
- Immediate floor: $1,390–$1,410 (Bollinger middle and short-term technical zone)
- Near-term support: $1,360 (recent intraday low)
- Deeper retracement zone: $1,170–$1,210 (identified by Alpha Crypto Signal)
Traders cutting leveraged positions during the pullback have increased the probability of lower near-term volatility. Derivatives metrics recorded a drop in dollar-denominated open interest on some platforms, consistent with risk reduction across futures desks.
Derivatives, on-chain flows and whale activity
Derivatives data from exchanges help illustrate how positioning shifted as the market reversed. One snapshot of OKX perpetual futures on Sept. 28 showed open interest in dollar terms falling from approximately $190.69 million to $164.95 million over 24 hours as ZEC prices fell. That decline points to reduced outstanding exposure on the exchange but doesn’t specify which side of the market initiated the liquidation.
On-chain analysis added a notable development amid the pullback: a large wallet withdrew 2,640 ZEC (roughly $3.72 million at the time) from Binance shortly before announcing movements on social trackers. Over the prior month, the same wallet accumulated 14,190 ZEC, valued at about $20 million, via withdrawals from Binance and Gate. Exchange outflows of this kind can signal accumulation, cold-storage intent, or intermediate transfers—interpretation depends on follow-up on-chain behavior.
Exchange withdrawals alone do not prove long-term holding intent, but sustained accumulation by a single entity often attracts attention from traders and market-makers because it can reduce circulating sell-side liquidity.
Why September rallied: ETF flows and renewed retail interest
ZEC’s momentum in September was strongly tied to the launch of the first U.S.-listed spot Zcash ETF. Market participants noted renewed inflows and interest after Grayscale converted its long-running Zcash Trust into the ZCSH spot ETF on NYSE Arca in August, which helped drive traders to reprice the privacy coin.
During mid-September, ZEC pushed through $1,300 and later cleared $1,375 and $1,500, briefly trading above $1,600 before the recent reversal. The combination of ETF-related demand, concentrated liquidity pockets, and episodic derivatives positioning fueled a rapid appreciation—followed by a period of profit-taking and deleveraging that underpinned the current pullback.

Market sentiment and public commentary
Public figures and market voices also contributed to the narrative around Zcash. Gemini co-founder Tyler Winklevoss compared renewed interest in Zcash to earlier cycles, tweeting that ZEC 'feels like crypto in 2019,' a comment read by many as a sentiment indicator rather than a price forecast. Comments like this can help signal changing market psychology but should not be used as sole trade signals.
Protocol developments: Zakura, Zebra and the NU7 upgrade
Beyond price action, important technical work is underway on Zcash infrastructure. Gemini confirmed on Sept. 29 that its Zcash infrastructure now uses Zakura, an open-source full node implementation written in Rust. Gemini said Zakura reached chain tip in just over six hours during deployment tests compared with nearly a full day for Zebra, the previous node implementation. The migration was performed behind the scenes and should not affect customer deposits or withdrawals.
The network is preparing for NU7, a protocol upgrade that will sharply reduce block target spacing from 75 seconds to 25 seconds—effectively tripling block production cadence. The Zcash Foundation tentatively scheduled NU7 for Nov. 5, though final activation depends on deployment readiness and community coordination.
In advance of NU7, the Foundation released Zebra 6.4.2 on Sept. 25 to address a high-severity bug present in versions 6.4.0 and 6.4.1 that could allow a peer to remotely crash a node. The Foundation noted the flaw affected node availability but had no consensus or funds impact and urged operators to upgrade to the patched release.
What traders should watch next
For market participants, the immediate focus is price action around the $1,390–$1,410 band and whether ZEC can reclaim the $1,500 level. Key items to monitor:
- Technicals: Bollinger Bands middle at ~$1,410, RSI ~53, and volume trends on breakouts or breakdowns.
- Support zones: intraday floor ~$1,360 and the deeper $1,170–$1,210 band for potential longer-term setups.
- Derivatives: open interest and funding rates to see if deleveraging continues or positioning rebuilds.
- On-chain: significant exchange withdrawals and large-wallet accumulation patterns.
- Protocol events: the NU7 upgrade timetable and node software updates like Zakura and Zebra patches.
A decisive recovery above $1,500 would likely validate renewed bullish momentum and reopen upside targets near the $1,600–$1,700 area. Conversely, a sustained slide below $1,360 could trigger deeper retracement toward the $1,170–$1,210 range. As always, traders should combine technical levels with liquidity context, derivatives positioning, and on-chain movements to assess risk.
Bottom line
Zcash’s correction after a sharp September rally is a reminder that even ETF-driven catalysts and strong momentum can be followed by rapid consolidation. Current indicators show reduced short-term buying pressure but no clear oversold signals; deeper support exists if the pullback extends. Protocol progress—Zakura deployments and the NU7 upgrade—adds a longer-term narrative that could sustain interest in ZEC beyond immediate price swings. Investors and traders should watch the $1,390–$1,410 pivot, liquidity below $1,170, derivatives flows, and on-chain whale behavior for the next directional clues.

Leave a Comment
Comments (1)
whoa ZEC pumping then cools off… ETF hype is real but this pullback smells like profit taking. holding some, but cautious.