

Bitcoin tumbles 18% in seven days as tech stocks and ETFs sell off
Bitcoin slid to roughly $55,935 on Nov. 21, representing an approximate 18% drop from its opening price on Nov. 14. The decline accelerated as weakness in high-growth tech and AI-related equities spilled over into crypto markets and investors withdrew capital from U.S. spot Bitcoin ETFs. The sudden shift in risk appetite pushed the dominant cryptocurrency below its summer support level, prompting widespread liquidations among leveraged traders and renewed attention on technical support bands.
Key market moves and ETF outflows
On Binance, the BTC/USDT pair reached a session low of $55,130, dipping beneath Bitcoin's prior summer floor near $57,700. U.S. spot Bitcoin exchange-traded funds recorded significant redemptions: funds lost about $582.3 million on Nov. 19 alone, with BlackRock’s IBIT responsible for roughly $541.1 million of that outflow. From the start of November through Nov. 19, U.S. spot Bitcoin ETFs saw net outflows of approximately $3.47 billion, according to Farside Investors data.
ETF flows turned sharply negative after a brief inflow of $7.9 million on Nov. 16; the group then experienced combined withdrawals of around $1.13 billion over the next three trading days. On Nov. 19, IBIT dominated that day's redemptions, while other funds—such as Fidelity’s FBTC and Morgan Stanley’s MSBT—showed mixed flows, demonstrating the uneven redistribution of capital across institutional products.
Why investors pulled back
Multiple factors contributed to the sell-off. First, a rotation in equities followed Anthropic’s Nasdaq debut and initial enthusiasm for AI stocks, which later cooled. Second, macroeconomic data raised the prospect of higher U.S. interest rates: October consumer price index (CPI) figures showed a 0.4% month-over-month rise, with shelter costs contributing significantly. As rates rise, the opportunity cost of holding non-yielding assets like Bitcoin increases, reducing demand from both retail and institutional buyers.
Volatility and leveraged positions: liquidations surge
Leverage amplified losses during the sell-off. CoinGlass reported around $495 million in Bitcoin long liquidations on Nov. 20—about 92% of that day's total Bitcoin liquidations. Another CoinGlass snapshot put the total Bitcoin liquidations near $538 million on Nov. 20, underscoring how quickly margin positions were unwound as price momentum turned lower.
Chart-based traders watched potential liquidation clusters identified by heatmaps, with notable concentration zones above $62,700 and near $66,000. Should Bitcoin rebound into those ranges, traders who shorted or used inverse leverage could face squeeze dynamics that pressure the market back upward—or trigger additional volatility if confidence remains fragile.
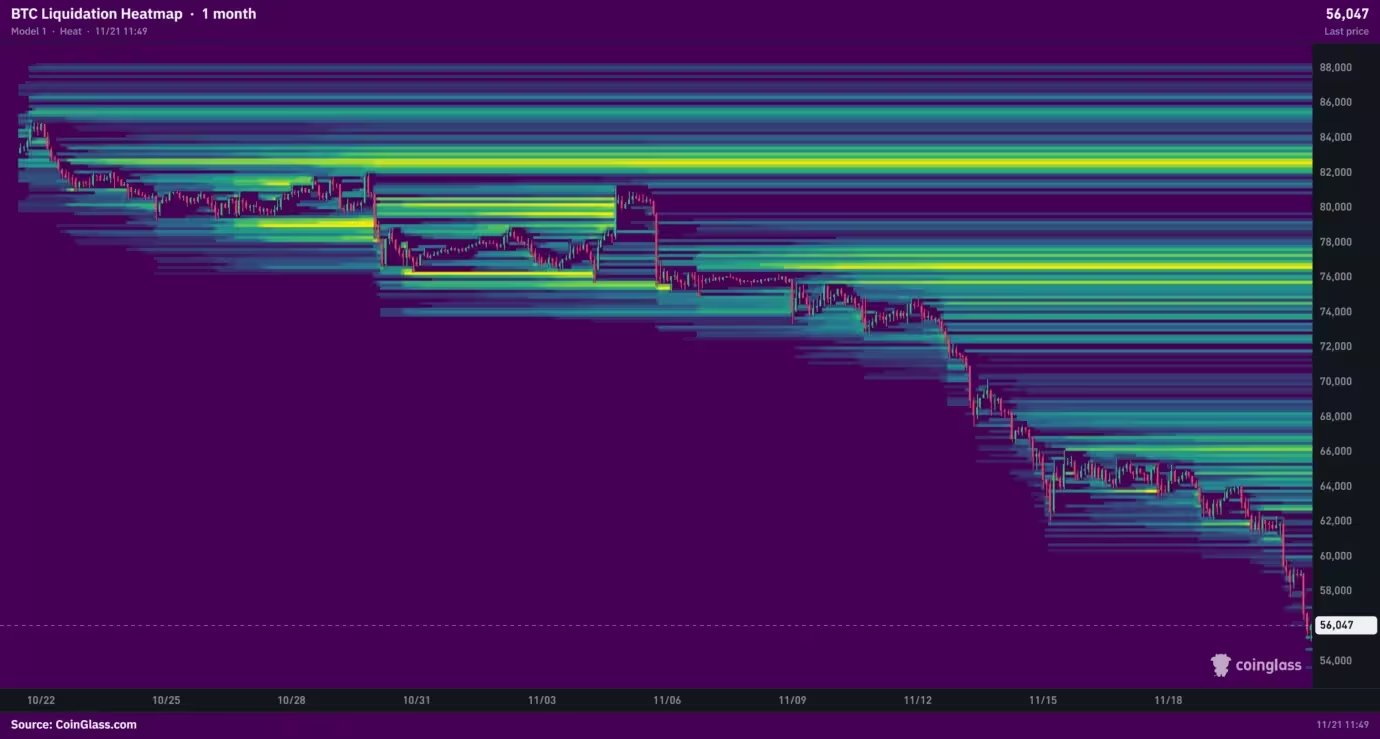
Bitcoin liquidation heatmap
Technical picture: Bollinger Bands, Murrey Math and key levels

From a technical standpoint, daily indicators signaled a strengthening downtrend. The price was trading slightly below the lower Bollinger Band at $56,231, indicating the move had pushed volatility beyond one standard deviation. The Average Directional Index (ADX) climbed to 46.93 as prices fell, pointing to growing trend strength to the downside. A retracement into the Bollinger envelope would first test the old summer floor at $57,700, followed by the $60,000 area where last week’s sell-off intensified.
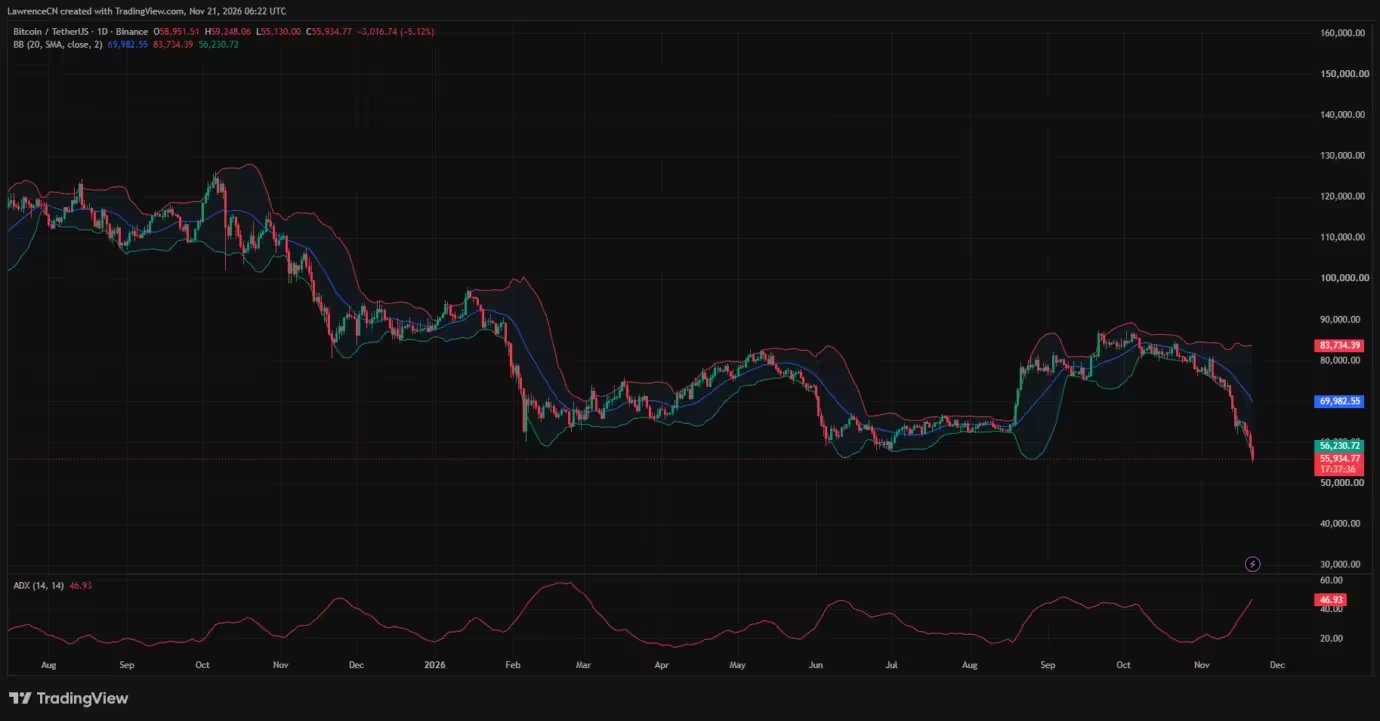
Bitcoin price daily chart — Nov. 21
On weekly frames the outlook also softened. Bitcoin’s weekly candle was down roughly 14.4% from its open near $65,351, and the asset traded below a Murrey Math support line at $62,500. The next lower Murrey Math target sits around $50,000, which would be about a 9% drop from the $55,130 session low. Weekly Chaikin Money Flow hovered slightly below neutral, signaling modest capital outflow from the asset class at a multi-week level.
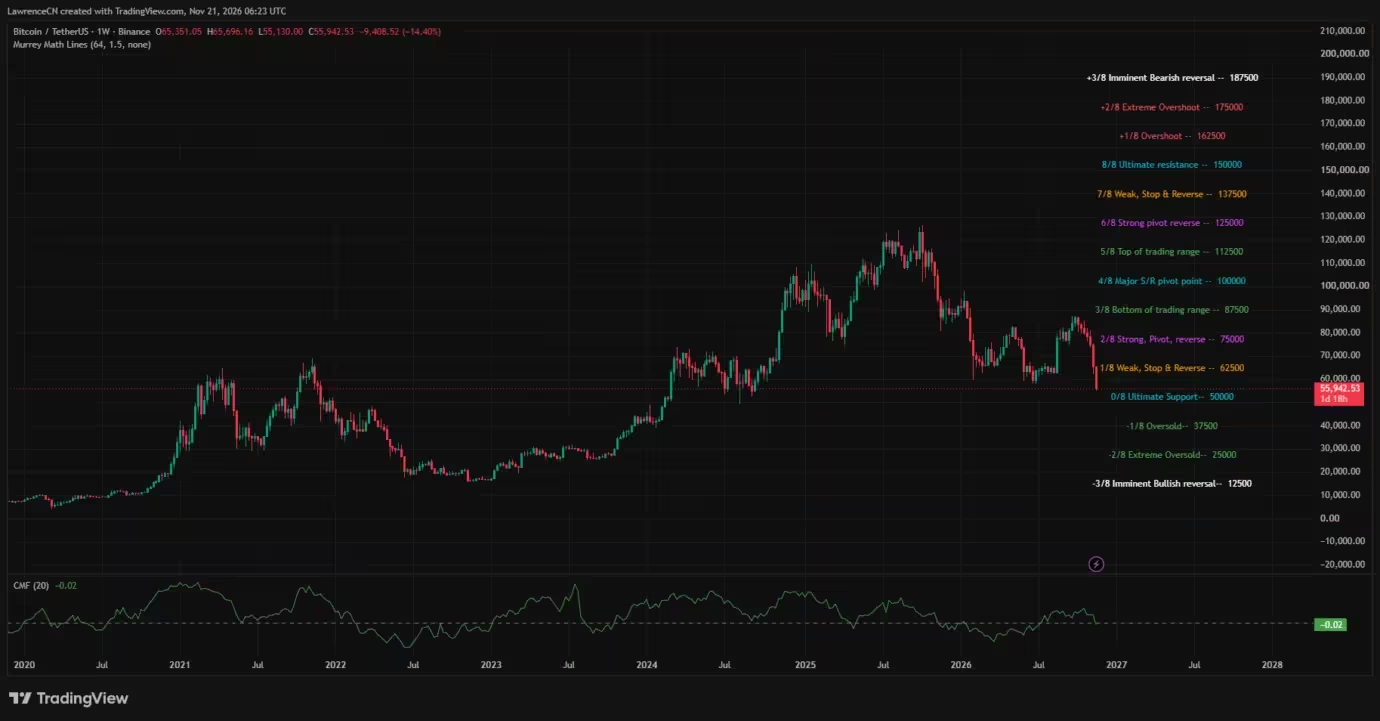
Bitcoin price weekly chart — Nov. 21
Market commentary and scenarios
Market analysts have highlighted both bullish and bearish scenarios based on weekly signals and broader market structure. Some commentators had warned that failure to push past local highs earlier this year could set up extended downside if equity markets corrected deeply—an outcome partially realized as tech stocks retraced after the AI-related IPOs and earnings re-ratings. Conversely, a clear weekly buy signal or an ETF-led inflow reversal could stabilize prices and attract dip buyers back into the market.
Implications for miners, funds and traders
Bitcoin miners and blockchain infrastructure companies also felt the pressure. Mining operators with public equities saw notable intraday declines—reflecting how equity-market flows and macro headlines can influence the broader crypto ecosystem. For ETF holders, many were already sitting on unrealized losses heading into the recent slide; Bitfinex estimated that ETF investors’ average entry price put Bitcoin nearly 25% above spot before the latest leg down, suggesting some holders could use any partial price recovery to reduce exposure.
For leveraged traders, the immediate concern is liquidation risk: concentrated clusters above current price levels could trigger cascades if volatility spikes. For institutional investors, continued ETF outflows would keep selling pressure on liquidity and may depress price action until inflows resume or macro drivers change.
What to watch next
- ETF flows: whether inflows reappear and which products lead the shift.
- Macro data and Fed communication on rates, which will affect risk asset allocation.
- Technical support at $55,130 and the $50,000 Murrey Math level as downside references.
- Liquidation heatmap zones—retests of $62,700–$66,000 could prompt short squeezes or renewed volatility.
In short, Bitcoin’s sharp seven-day drop highlights the market’s sensitivity to equity rotations, ETF flows, and macroeconomic signals. Traders and investors should monitor flows, derivatives liquidations, and key technical levels to assess whether the recent weakness is a corrective pause or the start of a deeper drawdown.


Leave a Comment
Comments (1)
whoa, 18% in a week? brutal. ETFs bailing, tech wobble, miners bleeding. if CPI keeps spiking this could get uglier... but maybe a strong bounce soon? idk