
3 Minutes
Bitcoin Climbs Toward $117,000 as Correlation with Gold Strengthens
Bitcoin gained momentum Wednesday, approaching the $117,000 mark as traders shrugged off the threat of downward liquidity. The move came alongside fresh all-time highs in gold, renewing conversations about Bitcoin’s role as a digital store of value and the growing correlation between BTC and traditional safe-haven assets.
Intraday action and market context
Data from Cointelegraph Markets Pro and TradingView showed BTC/USD touching local highs of roughly $116,593 on Bitstamp before consolidating. After a positive end to September — up about 5.2% for the month and 6.3% for Q3 — the market’s attention pivoted to whether Bitcoin could press toward a new all-time high.
BTC/USD one-hour chart
Analyst views: resistance, liquidity clusters and possible outcomes
Market commentators pointed to $117,500 as a key resistance level; reclaiming that zone could pave the way for renewed bid-side momentum and an attempt at a fresh ATH. At the same time, order-book liquidity remains a central theme for traders. Aggregated exchange data highlights concentrated zones of leveraged positions that can influence price behavior quickly.
BTC/USDT one-day chart
One widely circulated view outlined two major liquidity clusters: a long-heavy band around $107,000–$108,000 with an estimated $8 billion of long liquidation risk, and a short-heavy band near $118,000–$119,000 with roughly $7 billion of short liquidation exposure. Which cluster gets triggered first could determine whether price gets pulled down to sweep longs or pushed higher to squeeze shorts.
Why liquidity zones matter and the risk of fakeouts
Liquidity on order books often creates volatility as large traders and institutional participants hunt for stops and use leverage. That means apparent breakouts can quickly reverse, producing so-called “fakeouts” either higher or lower. On-chain and derivatives dashboards continue to show sizable open interest and a mix of long and short bets — conditions that historically have amplified intraday swings.
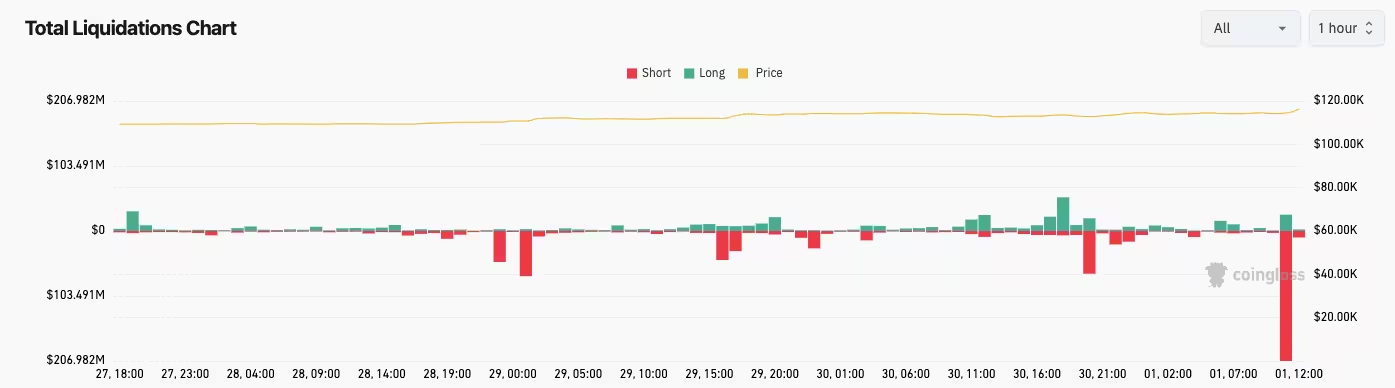
Crypto liquidations
Recent liquidation signals
Short liquidations across crypto markets reached hundreds of millions in a 24-hour window, underscoring how fragile leveraged positions can be amid quick directional moves. Some traders warned of imminent longs being flushed if price retraces enough to hit concentrated stop zones.
Gold’s rally and the Bitcoin–gold dynamic
Gold surged to anew all-time high near $3,895 per ounce this week, and many traders expect Bitcoin’s price action to mirror gold with a lag. Several analysts and traders shared charts showing BTC priced in gold attempting to breach long-term resistance, fueling speculation that BTC’s latest strength is partially driven by a risk-on rotation into crypto.
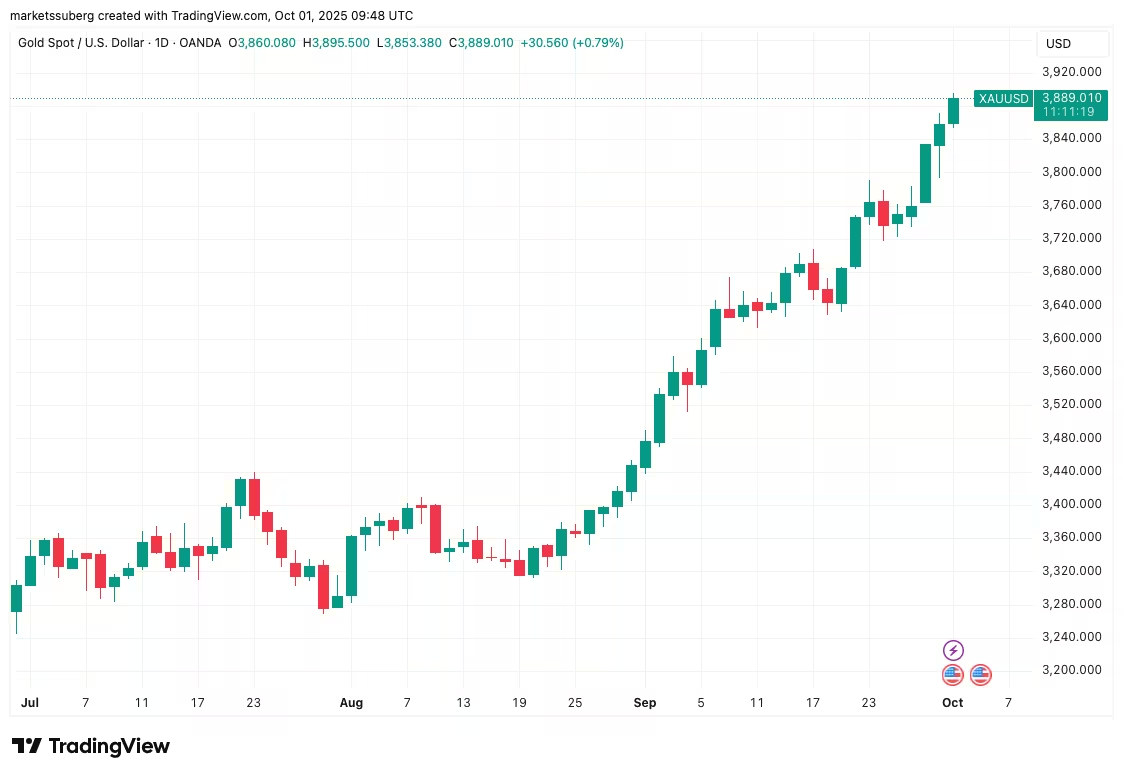
XAU/USD one-day chart
Opinions differ among market researchers: some see gold’s rally as stretched and likely to cool, which could shift flows into risk assets like Bitcoin. Others caution that herd behavior around both markets can produce sudden reversals, reinforcing the need for disciplined risk management.
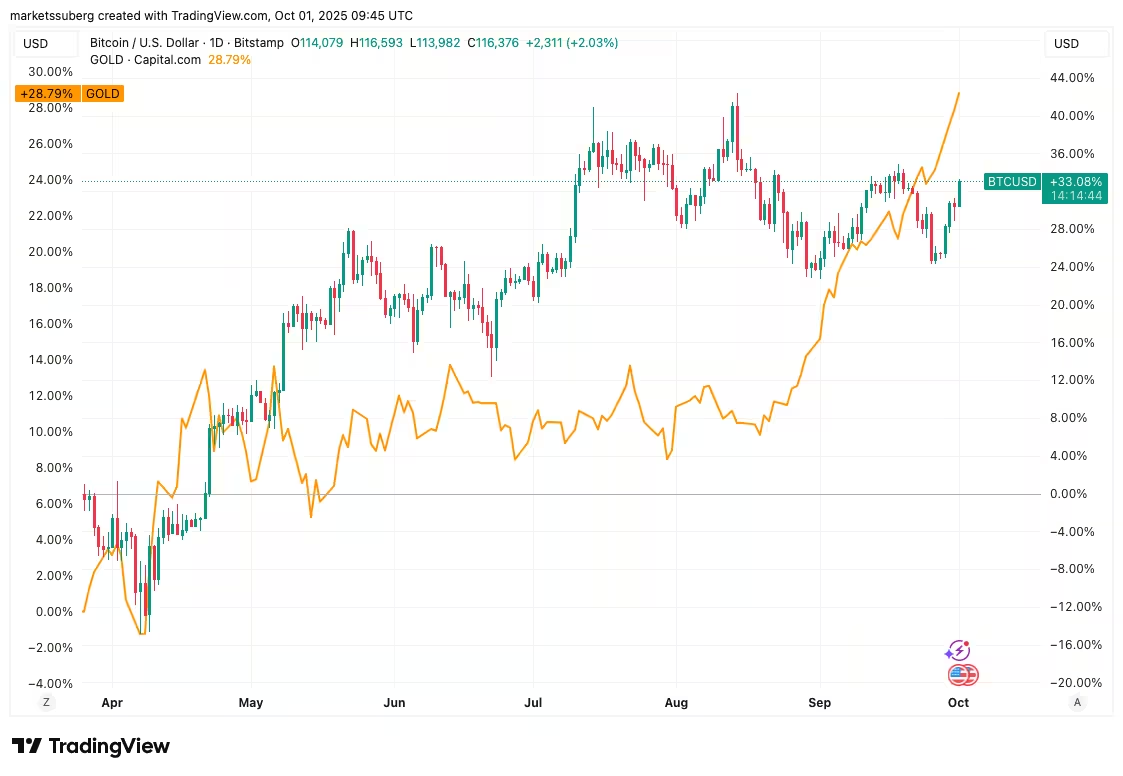
BTC/USD vs. XAU/USD one-day chart
What traders should watch next
Key levels to monitor remain the lower liquidity band near $107k–$108k and resistance above $117k–$118k. Traders should also track derivatives metrics like open interest and liquidation heatmaps, along with macro drivers (US equities and dollar action) that could influence both gold and Bitcoin. For now, BTC’s attempt to follow gold’s trajectory is a central narrative — but concentrated liquidity and leveraged positions mean volatility is likely to persist in the near term.


Leave a Comment
Comments
No comments yet. Be the first.