
4 Minutes
Bitcoin rallies to $118,473 as investors seek safe havens
Bitcoin staged a notable recovery, climbing back to $118,473 on Oct. 2 as traders shifted into digital assets and gold amid the U.S. government shutdown. The move extended BTC’s weekly gain to roughly 6% and its 30-day advance to about 7.4%, leaving the cryptocurrency within 5% of its August all-time high. Rising trading activity and renewed positioning in derivatives markets accompanied the price rebound, underscoring market conviction behind the move.
Market flows and derivatives activity
Derivatives volume and open interest surge
Coinglass data shows derivatives volume jumping 50.6% to $122.8 billion, while open interest increased about 6% to $86.6 billion. The combination of higher volume and rising open interest typically signals fresh directional bets from traders, rather than one-off speculative spikes. Those shifts helped pull overall crypto market capitalization up roughly 3.5% to near $4.16 trillion, contributing to the seasonal optimism often labelled “Uptober.”
Why Bitcoin benefited during the shutdown
The rally coincided with the first U.S. federal government shutdown since 2018 after Congress failed to pass a budget ahead of the Oct. 1 deadline. The funding impasse rattled traditional risk assets—S&P 500 futures slipped and the dollar softened—while safe-haven instruments like gold and Bitcoin attracted flows. Gold touched record highs near $3,850 per ounce as investors sought protection; Bitcoin’s fixed 21 million supply narrative re-emerged as a reason for allocators to add BTC to hedge against fiscal and debt credibility concerns.
Regulatory and policy developments also helped sentiment. U.S. spot Bitcoin ETFs recorded nearly $1 billion in late-September inflows, and large funds such as BlackRock’s offering surpassed $80 billion in assets under management. Separately, a Treasury clarification that unrealized corporate gains would not be taxed has been interpreted as a possible encouragement for businesses to consider holding Bitcoin on their balance sheets for the long term.
Technical overview: momentum remains bullish
Key indicators and resistance levels
From a technical standpoint, BTC’s move above $118,000 placed it above multiple short- and mid-term moving averages. The relative strength index (RSI) sits near 63, indicating bullish momentum without an overbought signal. Momentum indicators such as the MACD and the Awesome Oscillator are flashing buy signals, and price action is holding above the 10- and 20-day EMA and SMA.
Bollinger Bands point to growing volatility as price approaches the upper band around $119,878. Traders will be watching the $119,900–$124,000 zone as crucial resistance; a decisive close above $119,900, particularly if ETF inflows and macro risk persist, could clear the path toward August’s record highs. Conversely, failure to hold near-term gains might trigger consolidation around $114,000 with deeper support nearer $108,900 should selling pressure return.
Outlook and implications for investors
Institutional and retail participants are likely to keep a close eye on macro headlines, ETF flow reports, and derivatives metrics to infer the durability of this rally. If the shutdown prolongs or other geopolitical or fiscal risks intensify, safe-haven demand may continue to support Bitcoin and gold. However, short-term traders should remain mindful of volatility indicators and key moving averages when sizing positions.
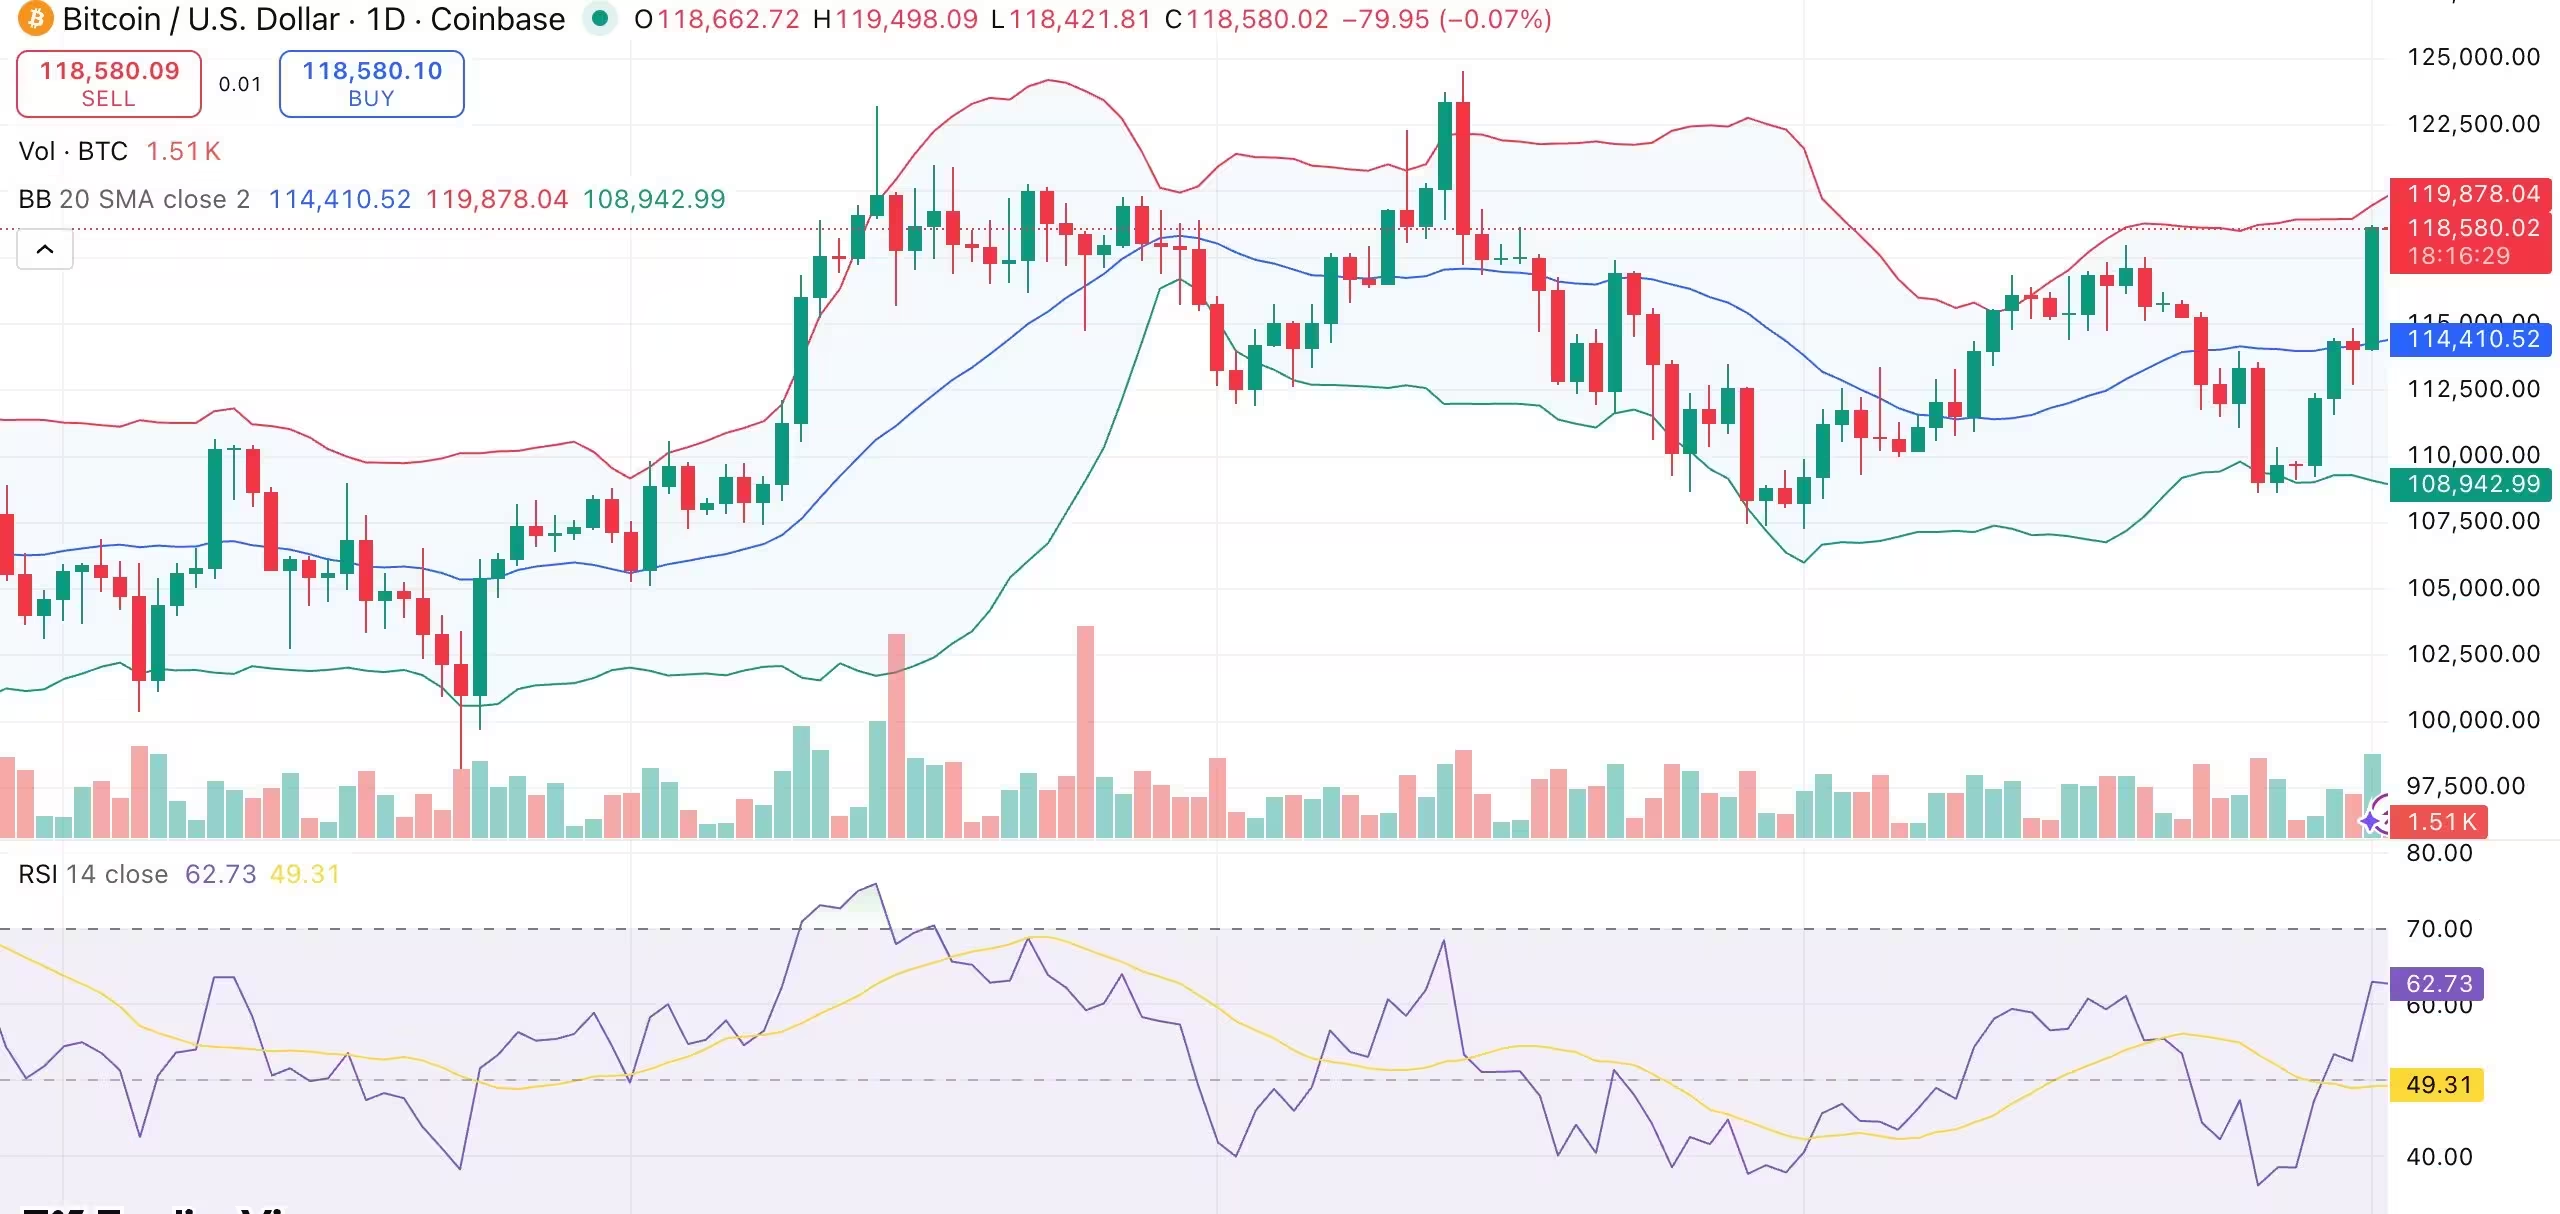
Bitcoin daily chart
Overall, the shutdown-driven rotation into risk-averse assets, continued ETF inflows, and supportive on-chain and derivatives signals have combined to lift BTC back into a bullish posture—at least while macro uncertainty persists.
Source: crypto
Leave a Comment