
4 Minutes
BNB extends breakout into price discovery
Binance Coin (BNB) continues to build a compelling bullish narrative as the token advances beyond a multi-year trading range and heads into price discovery. Market structure across monthly and higher timeframes shows a clean progression of higher highs and higher lows, signaling sustained buying pressure and institutional interest.
Key technical drivers
BNB's rally has been characterized by consecutive bullish engulfing candles on multiple timeframes, a pattern traders often read as confirmation of momentum. Volume analysis reinforces this view: inflows have increased alongside price, suggesting buyers are committing capital rather than locking in profits. These elements combine to support a continued push up the charts.
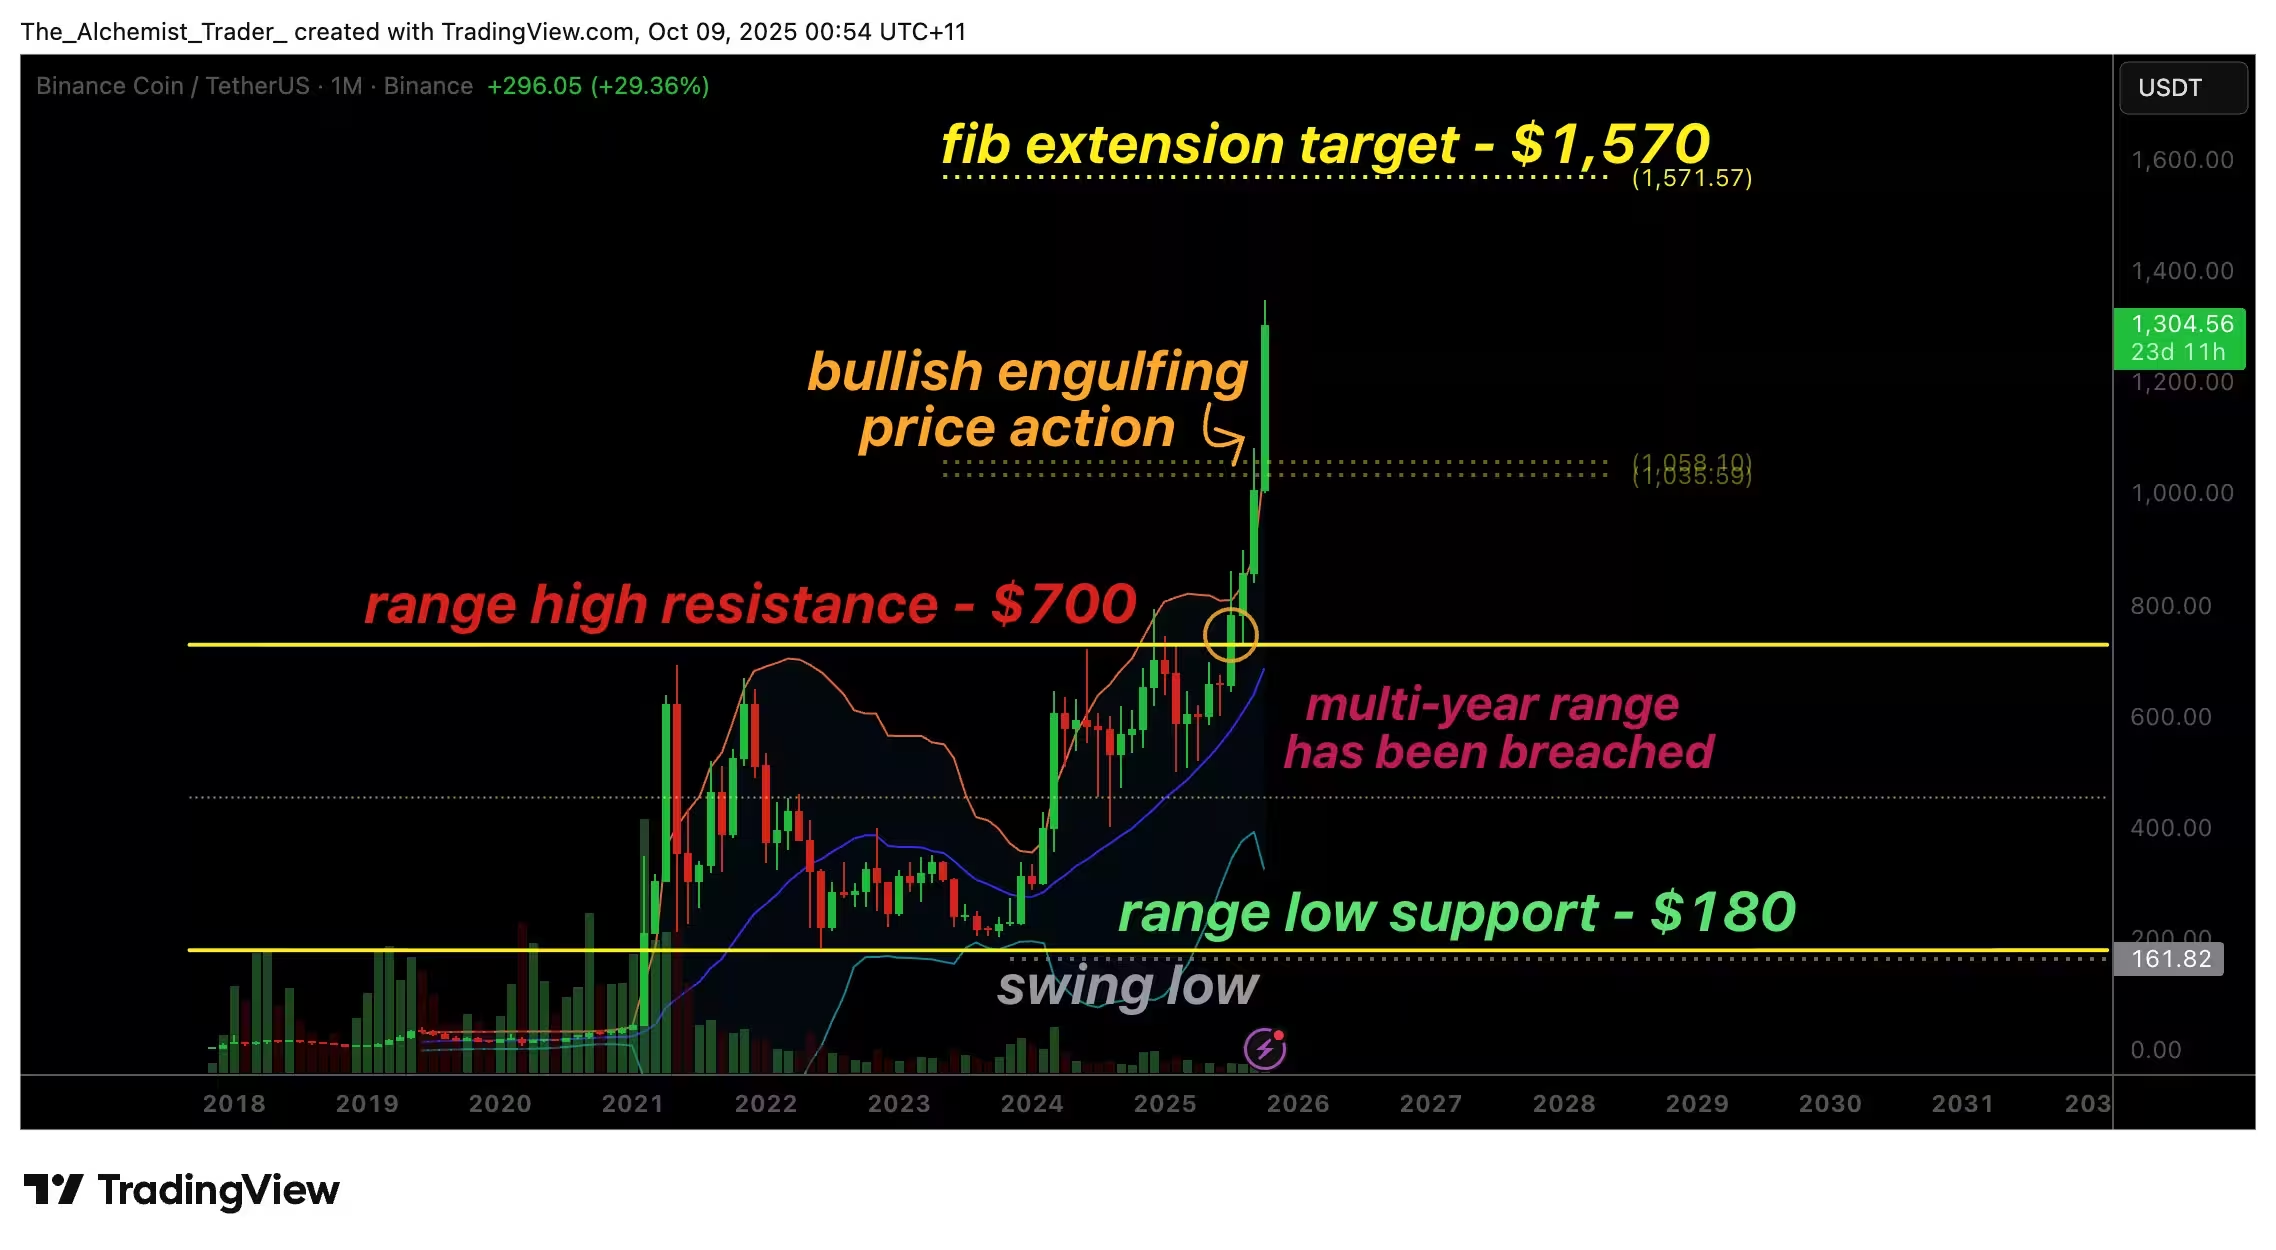
BNBUSDT (1M) Chart
From a technical standpoint, the next major Fibonacci extension target is at $1,570. With price trading comfortably above the prior breakout zone near the $1,000 level, BNB faces limited historical supply until that extension is tested. In crypto markets, such zones are commonly referred to as "blue-sky territory," where overhead resistance is sparse and price discovery can accelerate.
Why $1,570 is the focus
The $1,570 level corresponds to a common Fibonacci extension projection based on the recent breakout move. Because BNB cleared previous structural highs without significant retracement, traders are using Fibonacci levels to map potential upside targets. The minimal resistance between the current price and that extension allows momentum to carry price further if buying volume remains strong.
Volume and market structure: what they reveal
Rising volume at elevated price levels is a bullish confirmation: it indicates market participants are adding positions and that selling pressure is not overwhelming the advance. The presence of higher lows on monthly charts shows that dip buyers are active, defending key retracement zones when corrections occur.
Ecosystem developments are also supportive. Increased activity on Binance’s memecoin launchpad — which recently outpaced comparable platforms in daily revenue — points to renewed engagement and liquidity within the broader BNB ecosystem. Higher ecosystem throughput can often translate into stronger token demand over time.
How traders should approach the move
For traders and investors, the path of least resistance currently points upward as long as BNB holds above the breakout region and volume remains healthy. Monitor daily and weekly candle structure for signs of exhaustion, such as shrinking bodies or long upper wicks on high volume. Volume divergence — where price rises but volume falls — would be an early warning that momentum may be weakening.
Risk management remains critical: even in blue-sky runs, sharp corrections can occur. Key levels to watch on the downside include recent breakout zones and major Fibonacci retracement areas where buyers have previously defended support.
Outlook
BNB appears positioned for further upside toward the $1,570 Fibonacci extension if current structure and volume dynamics persist. Bullish engulfing candles, consistent higher highs and higher lows, and expanding volume profiles together make a persuasive case for continuation. Still, traders should track volume behavior and candle formation closely for any signs of profit-taking or exhaustion that could stall the advance.
In short: momentum is strong, technicals favor the bulls, and the next objective on many traders' radar is the $1,570 Fibonacci extension. Maintain discipline, follow volume as confirmation, and be prepared for volatility — a hallmark of crypto price discovery.
Source: crypto
Leave a Comment