5 Minutes
The recent swoon across cryptocurrency markets has many investors asking: is the downturn finally close to bottoming out? After weeks of steep losses, several technical and market-wide indicators that historically precede recoveries are starting to align. Below we unpack the data, explain what these signals mean, and look at the likely catalysts that could spark the next crypto bull run.
Technical signals flicker green after a deep sell-off
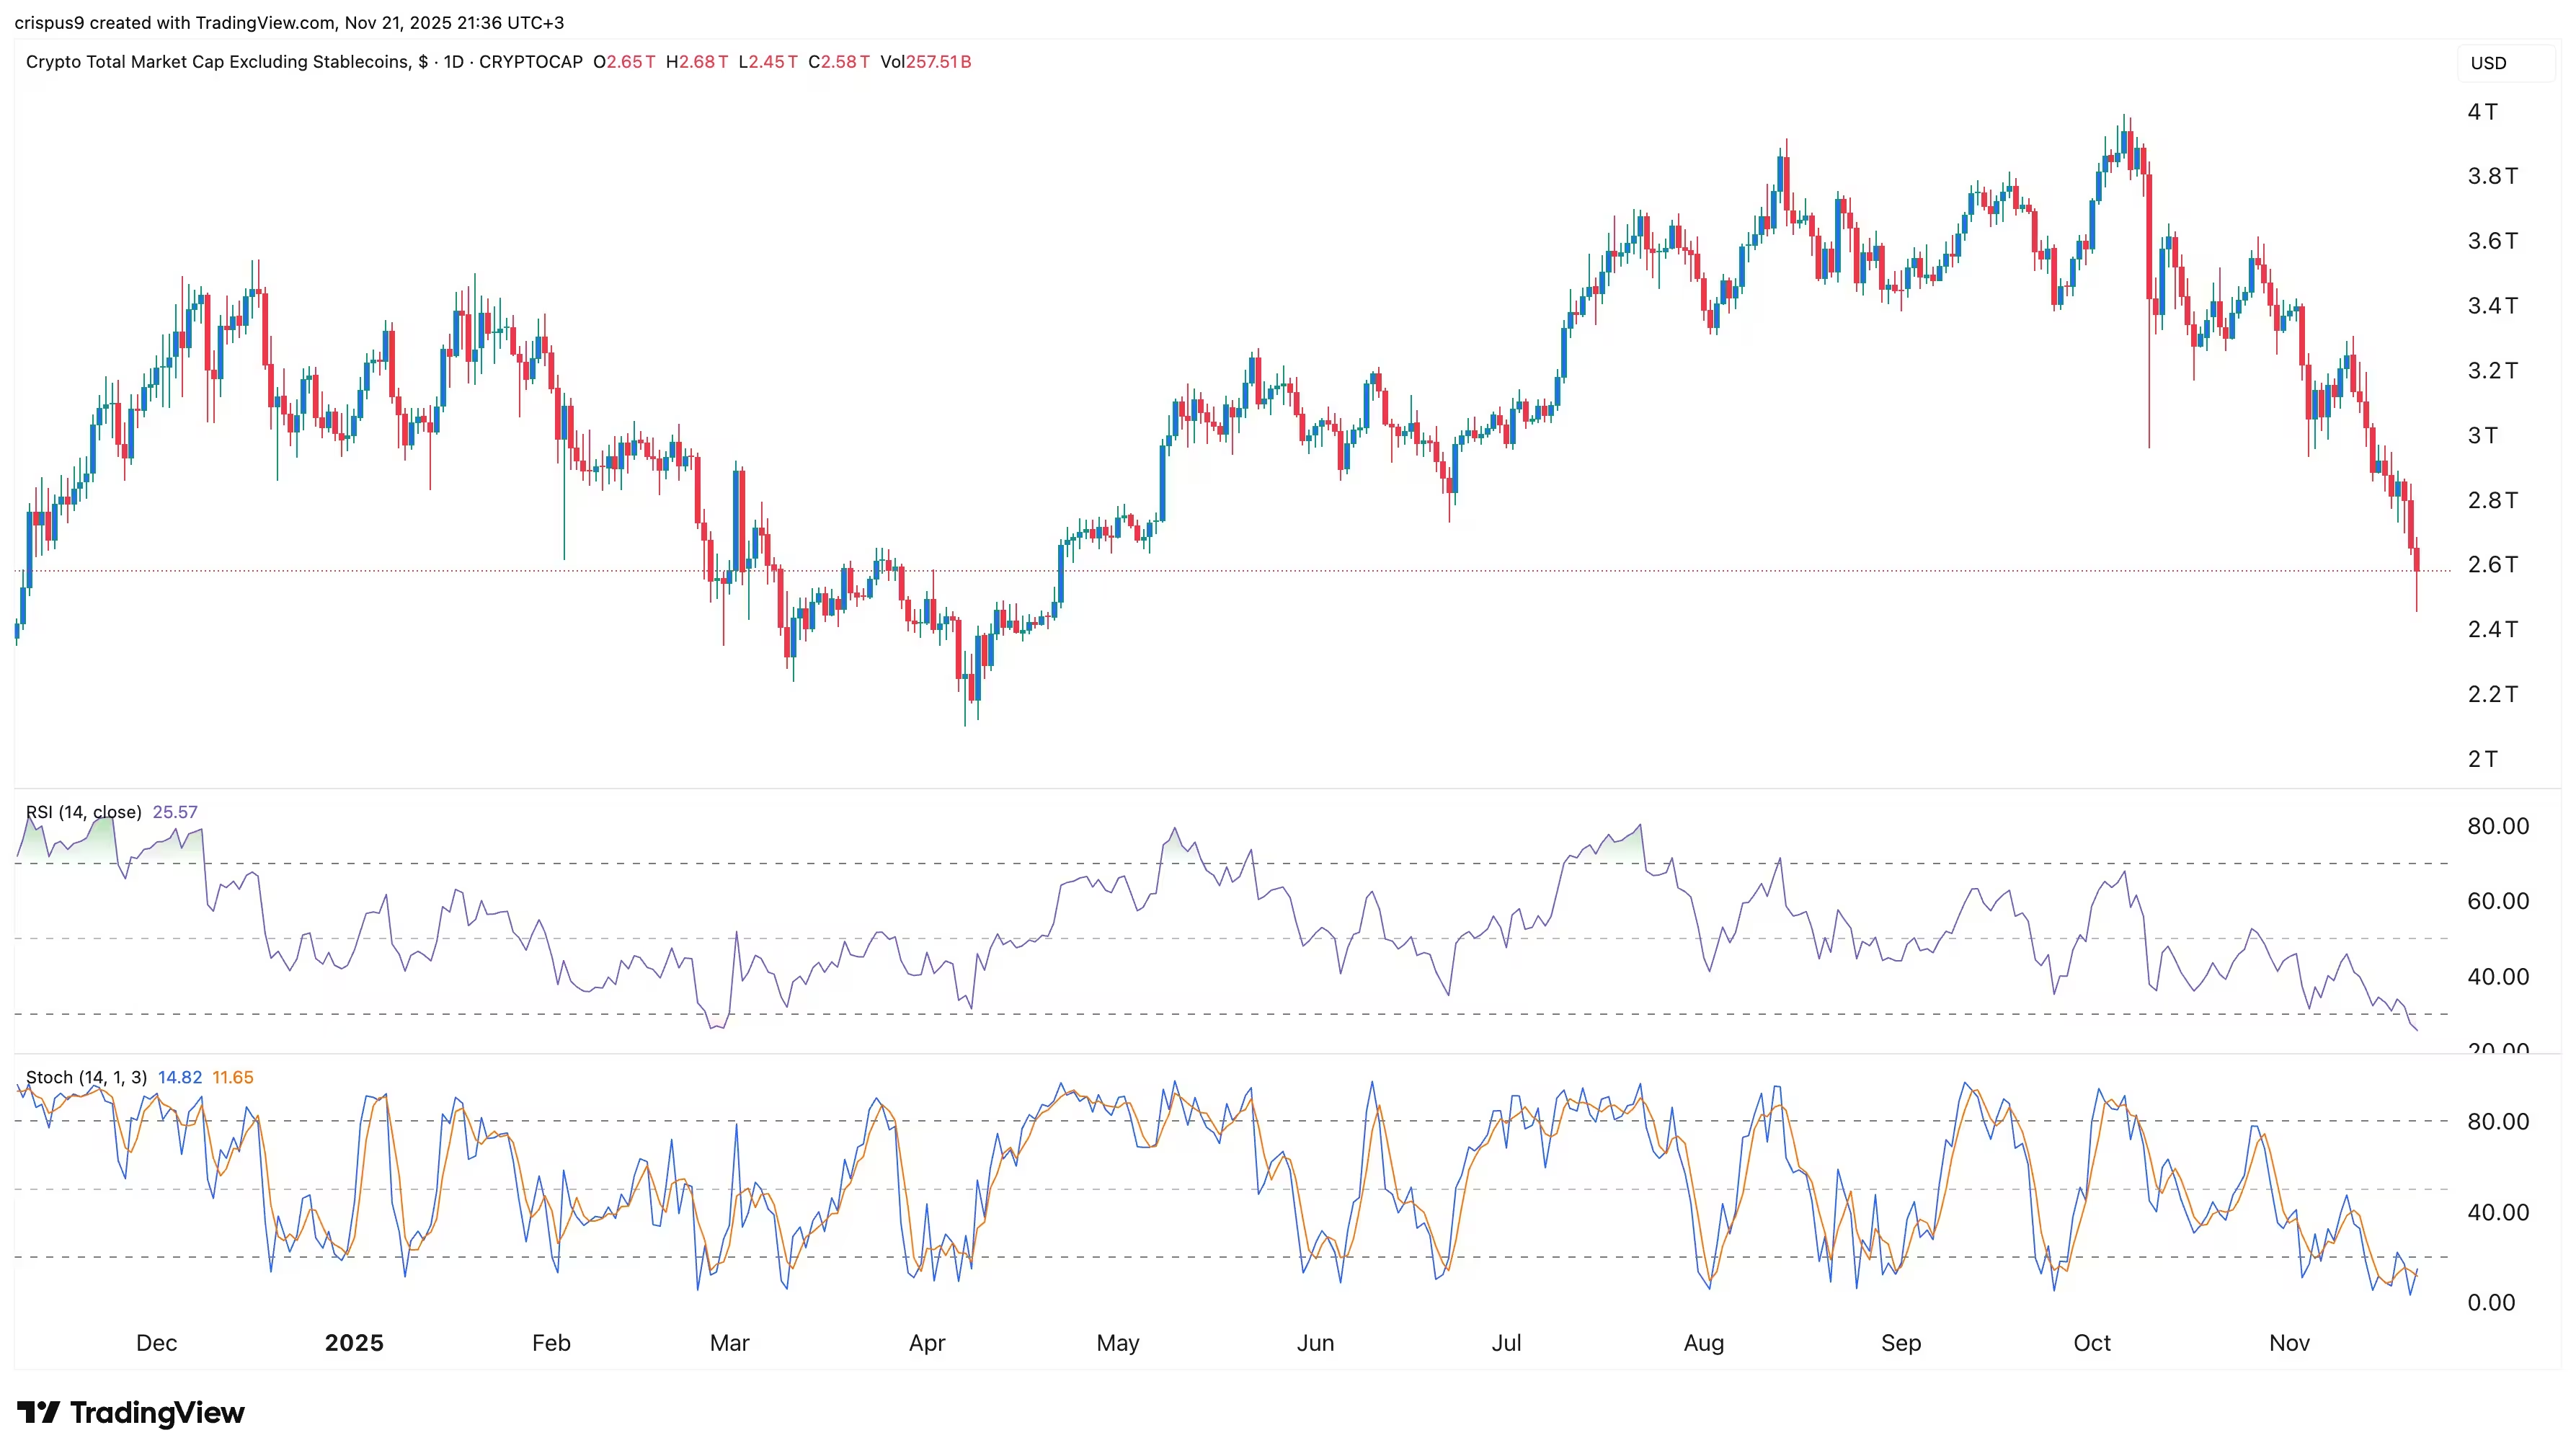
Bitcoin fell toward a critical support level near $80,000 while the combined market capitalization for all tokens slid toward roughly $2.9 trillion. The immediate picture looks bleak—most major altcoins posted double-digit weekly declines—but some indicators that traders and quantitative analysts watch closely are beginning to show relief.
Fear and Greed Index: a contrarian signal
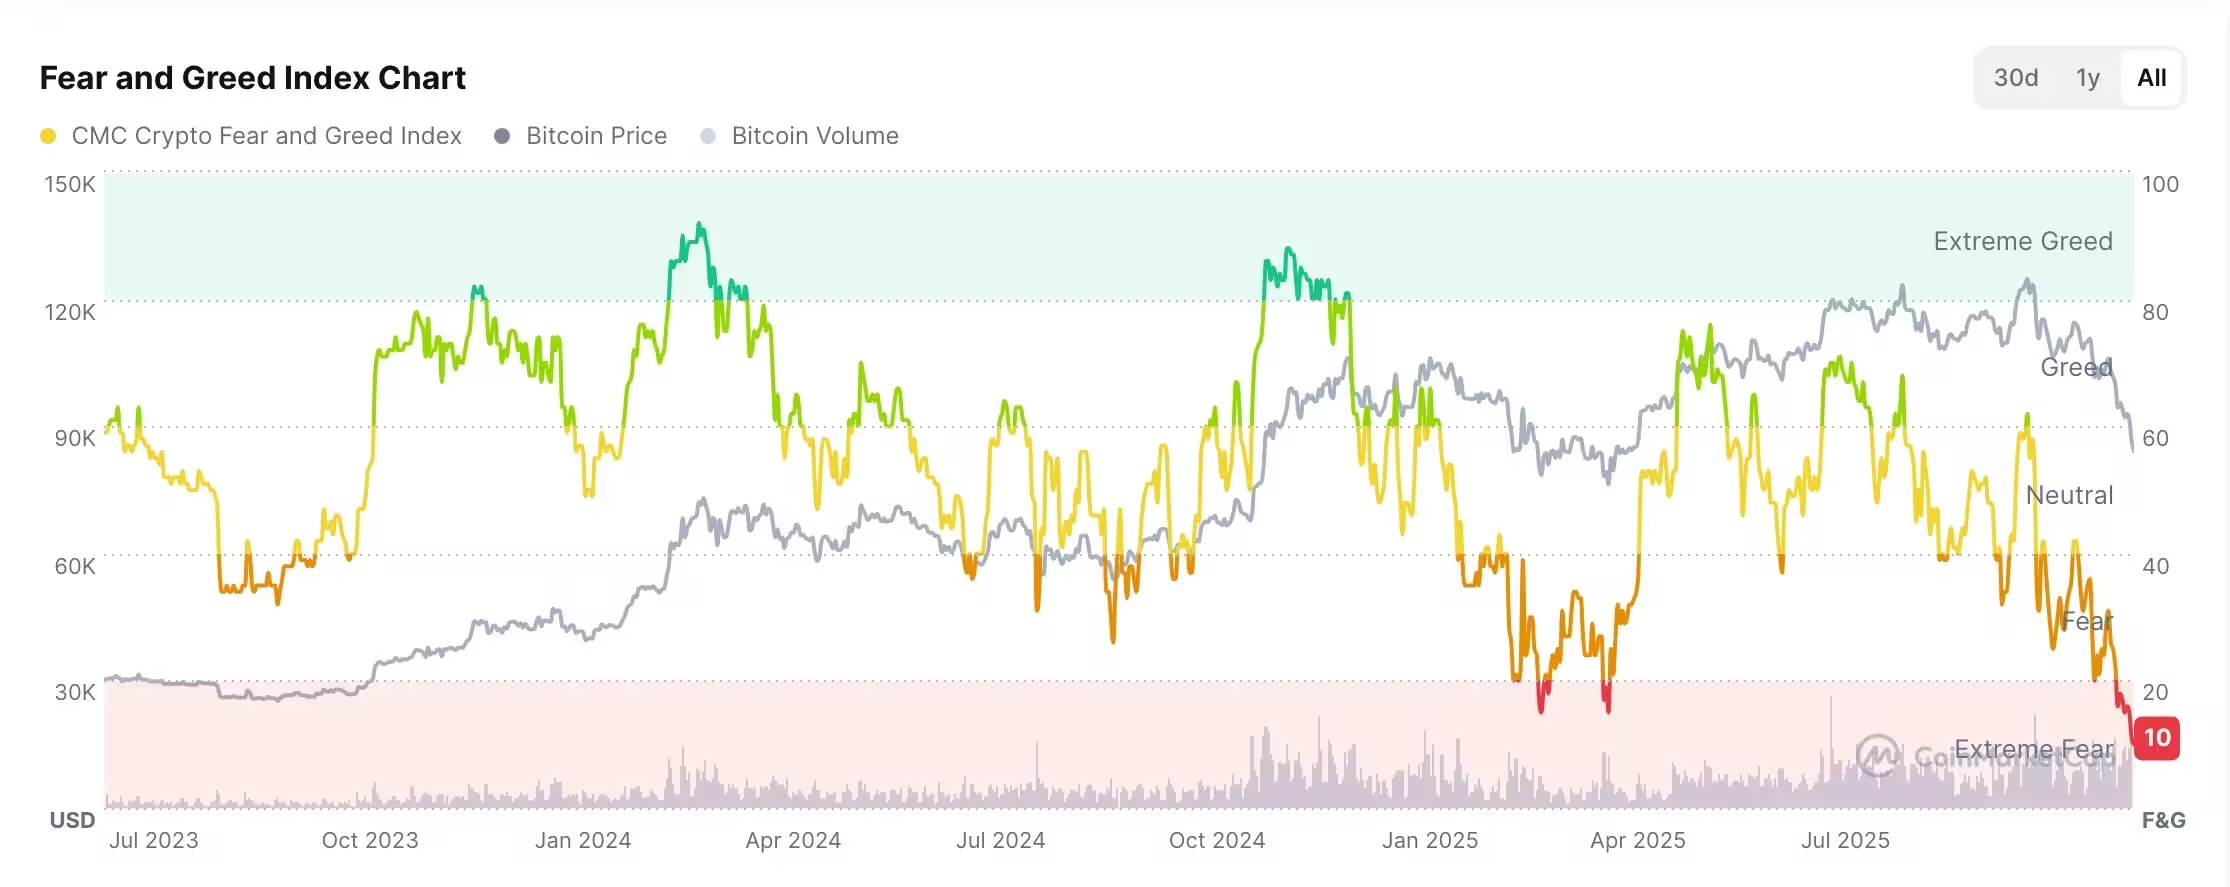
One notable metric is the Fear and Greed Index, which recently plunged to an annual low around 10. This index aggregates market emotion from volatility, momentum, social media sentiment and other inputs. Historically, extreme readings in the “fear” zone have often preceded the early stages of rallies, because panic can clear out excessive leverage and force a capitulation that sets the stage for accumulation.
Relative Strength Index (RSI) and oversold territory
On a broader-system scale, the Relative Strength Index for the crypto market cap is hovering near 24—well below the traditional oversold threshold of 30. RSI is a momentum oscillator used in time-series analysis to signal when an asset is potentially undervalued or overextended. When an entire asset class moves into deeply oversold territory, it increases the statistical probability of a bounce, though it does not guarantee a straight-line recovery.
Market structure: leverage is being wrung out
Another structural development is the reduction in leveraged positions. Futures open interest has contracted significantly—currently near $123 billion from a year-to-date peak above $320 billion. Large-scale liquidations since mid-October have exceeded $40 billion, removing highly leveraged, fragile positions from the ecosystem.
Why does this matter? Lower open interest usually means the market is less crowded with forced sellers. That reduces the risk of cascading liquidations during volatility spikes and can create a healthier environment for more sustainable price discovery.
What could actually trigger a sustained rally?
Technical bottoms require a catalyst. Several macro and sector-specific factors could act as ignition points:
- Monetary policy easing: Rising odds of Federal Reserve rate cuts would typically improve risk appetite across asset classes, including crypto.
- Liquidity signals: A bounce in M2 money supply or other liquidity measures can provide fuel for risk assets.
- Product approvals: Continued approvals of altcoin exchange-traded funds (ETFs) could broad-base demand and attract institutional flows.
- Seasonality: Historical patterns like a late-year Santa Claus rally sometimes coincide with calmer markets and renewed buying interest.
None of these catalysts assures a swift recovery. Expect the early phase of any rebound to be choppy—markets may form a double-bottom or a series of higher lows rather than a parabolic climb.
Connecting market data to robust analysis
Think of crypto market signals like a noisy telescope: you need multiple instruments—momentum indicators, open interest, social sentiment—to triangulate a reliable signal. Techniques from quantitative finance such as signal-to-noise filtering, cross-validation across time frames, and volatility clustering analysis help distinguish temporary bounces from regime shifts. In short, data-driven approaches improve the odds of correctly interpreting what looks like a market turning point.
Expert Insight
“We’re seeing a classic deleveraging phase that often precedes an accumulation cycle,” says Dr. Lena Márquez, a market structure analyst. “When open interest collapses and sentiment hits extreme fear, it removes fragile positions and can create a more stable foundation for institutional entrants. But patience is required—recoveries are probabilistic, not guaranteed.”
For readers, the pragmatic takeaway is to watch a combination of indicators rather than relying on a single metric. Monitoring the Fear and Greed Index, RSI, and futures open interest alongside macro cues like Fed guidance and ETF approvals gives a fuller, science-informed view of where the market may be headed.
Source: crypto
Comments
mechbyte
I lived thru 2018 crash, deleveraging felt similar. patience paid off then, tho. ETFs could change things, watching open interest and Fed signals closely.
arbflux
Can someone explain why Fear & Greed at 10 means a bottom? seems like capitulation but also could be trap. RSI low ok, but liquidity is the real question…
Leave a Comment