5 Minutes
Overview: XRP’s January Slide and a Potential Rebound
XRP has retraced more than 20% from its January peak, falling to a monthly low near $1.81 after trading around $2.39 earlier in the month. While that pullback widened the gap from XRP’s all-time high, technical signals and on-chain flows suggest buyers are quietly preparing for a possible recovery. This article examines the catalysts behind the sell-off, the bullish technical setup that just emerged, and the key price levels and crypto market indicators traders should watch.
Why XRP Fell — Macro Headwinds and Market Sentiment
Several macro and regulatory factors pressured XRP and the broader crypto market through January. Geopolitical tensions tied to U.S. tariff disputes and renewed fears of a government shutdown weighed on risk assets. At the same time, delays to U.S. crypto market structure legislation and expectations of a persistently hawkish Federal Reserve added further selling pressure.
Despite those headwinds, demand metrics for XRP show resilience. Institutional flows and stablecoin activity on the XRP Ledger point to continued interest from longer-term holders rather than purely speculative traders.
On-Chain and Institutional Flows Bolster the Bull Case
Two developments are particularly noteworthy for investors:
- Stablecoin supply on the XRP Ledger rose by roughly $100 million this month and currently sits around $407 million. An increase in on-chain stablecoins often signals capital ready to be deployed into that blockchain’s ecosystem.
- XRP-focused exchange-traded funds recorded only two outflow days this month, with cumulative inflows reaching about $67.8 million. These steady ETF flows suggest institutional participants remain buyers, even amid macro uncertainty.
Investors have also moved XRP off exchanges at a steady clip. According to exchange flow analytics, outflows have outpaced inflows for several weeks — a behavior typically associated with accumulation and custody by long-term holders.
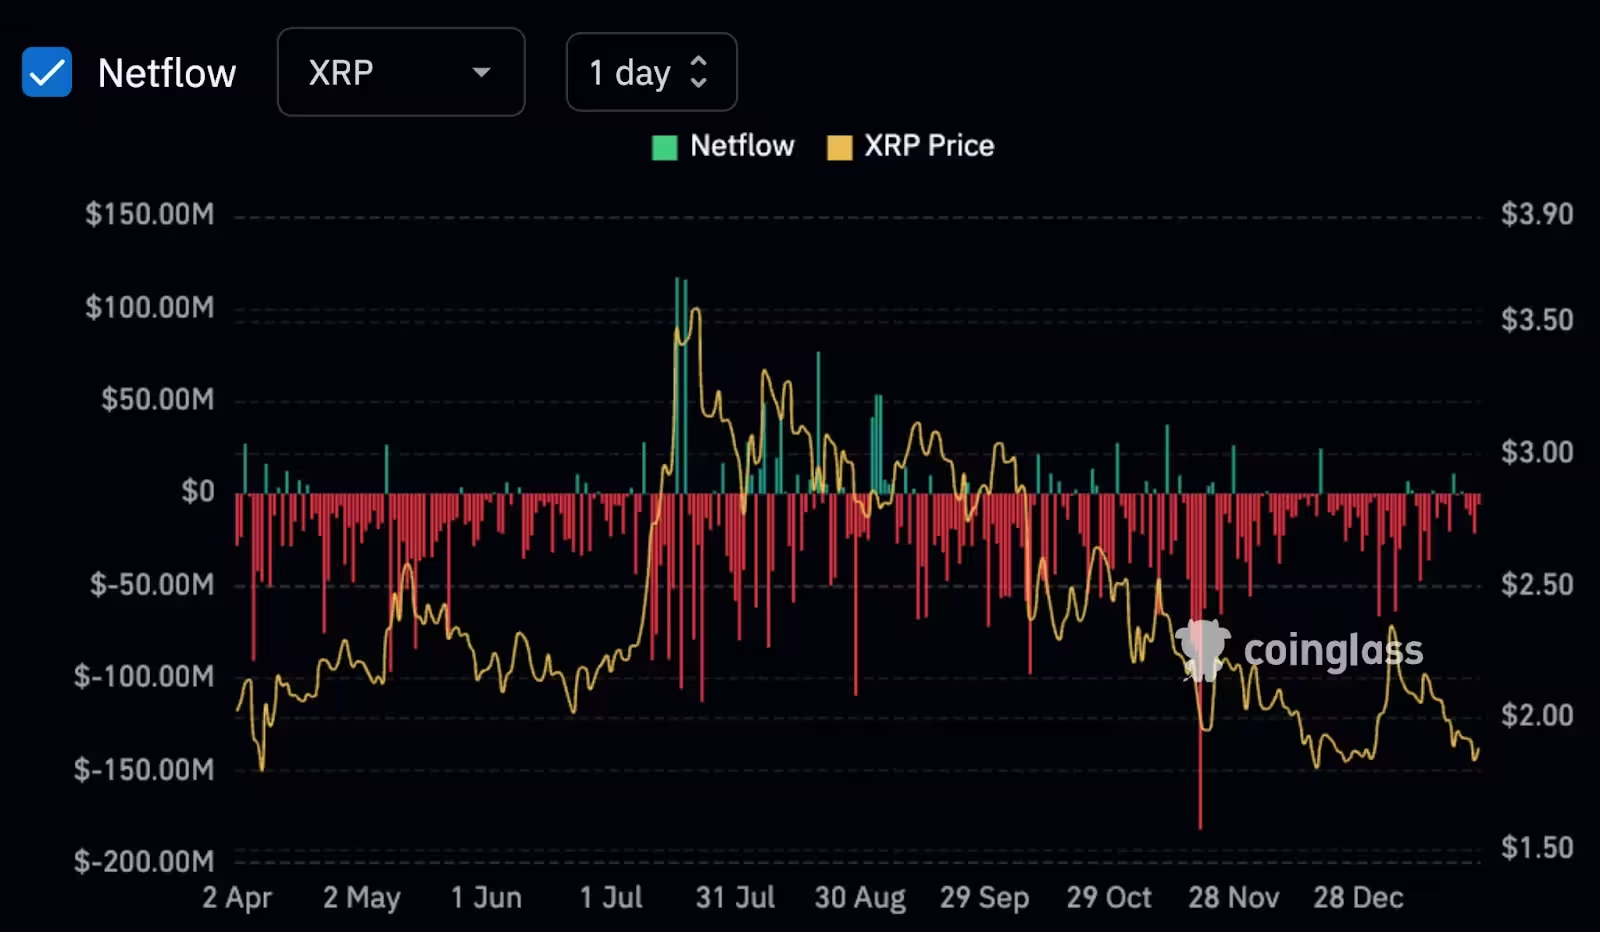
XRP spot inflow/outflow from exchanges
Technical Picture: Falling Wedge Breakout
On the 4-hour chart, XRP has cleared a descending trendline that had capped rallies since early January. That breakout is part of a larger falling wedge pattern — a bullish reversal setup formed by two converging downward trendlines. Breaking above the upper wedge boundary confirms the pattern and often precedes corrective rallies.
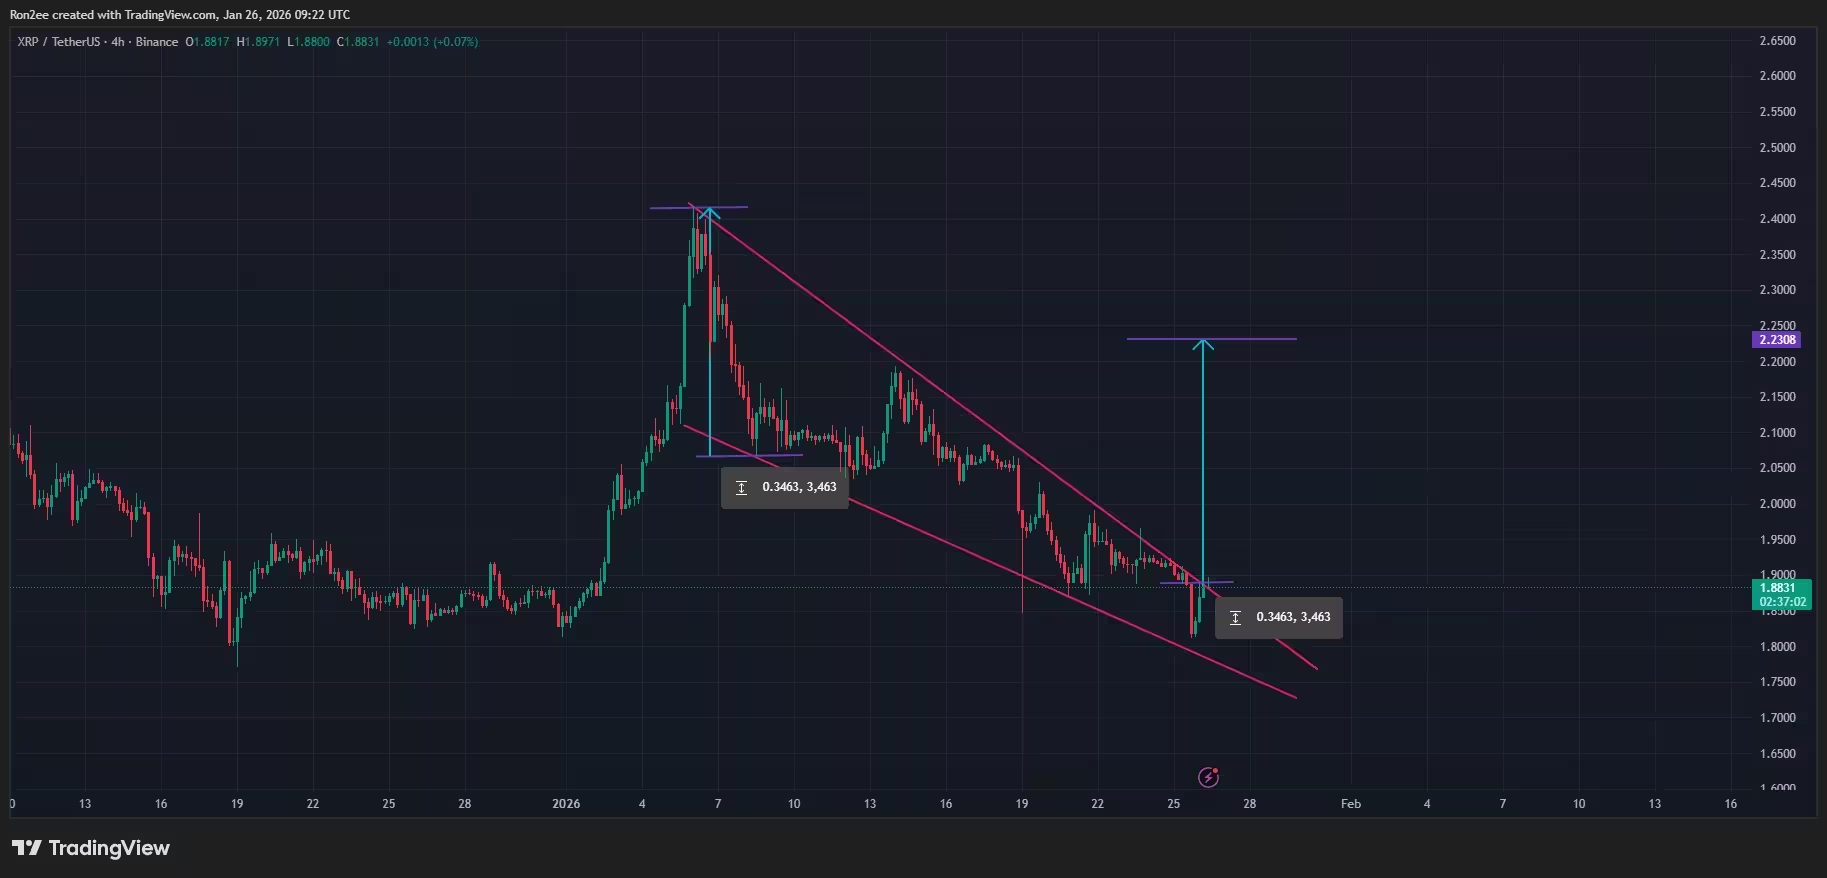
XRP price has confirmed a falling wedge pattern on the 4-hour chart — Jan. 26
Immediate Targets and Invalidations
Measured from the wedge’s height and projected from the breakout point, the next technical upside target sits near $2.23. If buying momentum continues, a retest of January’s local high around $2.39 becomes a realistic short-term objective.
On the downside, the $1.80 level is a critical psychological and technical support. A decisive break below $1.80 would negate the falling wedge thesis and could reopen the path toward lower monthly lows as traders revert to a risk-off stance.
What Traders and Investors Should Monitor
- Volume on the breakout: Confirmation requires follow-through volume. Higher trading volume on bullish candles would reinforce the breakout’s validity.
- ETF flow dynamics: Continued inflows into XRP ETFs indicate institutional conviction and can underwrite sustained rallies.
- Stablecoin activity: Rising stablecoin balances on the XRP Ledger suggest more dry powder available to enter XRP markets.
- Macro headlines: Geopolitical developments, U.S. fiscal news, and Fed commentary remain primary market drivers and can quickly flip sentiment.
Conclusion: A Conditional Bullish Set-Up
XRP’s break above the descending trendline and confirmation of a falling wedge give bulls a technical edge for a corrective rebound. Combined with steady ETF inflows and rising stablecoin supply on the XRP Ledger, there are credible reasons to expect a relief rally toward $2.23 and potentially back to $2.39 if momentum persists.
However, the recovery is not assured. Failure to hold above $1.80 or a return to risk-off macro headlines could invalidate the bullish case and push prices lower. Traders should weigh on-chain indicators and volume confirming the breakout before adding exposure.
For investors focused on crypto technical analysis and market structure, XRP’s current setup is a clear example of how on-chain liquidity and institutional flows can support price action even when macro forces apply downward pressure.
Source: crypto
Comments
Reza
Been watching XRP since 2017, saw these wedge plays before. If volume doesn't follow, this rebound could fizzle out. quick note,
coinpilot
Is this even true? Stablecoins on XRP up but price still sliding... where's the buying pressure coming from honestly?
Leave a Comment