
3 Minutes
Bitcoin faces a 100-day volatility test
Bitcoin’s next directional move may be decided within roughly 100 days as traders focus on an unusually tight Bollinger Bands setup on weekly charts. Market analysts say this historic compression in BTC volatility typically resolves within about three months — either with a strong breakout above resistance or a breakdown that could signal the end of the current bull market.
Why Bollinger Bands matter for BTC price action
Bollinger Bands measure volatility by mapping price against a moving average envelope. When the bands constrict — often called a "squeeze" — it signals a period of low volatility that tends to precede a significant directional move. On weekly timeframes, Bitcoin’s bands recently registered record tightness, prompting a wave of analysis and positioning among crypto traders.
Key image and data
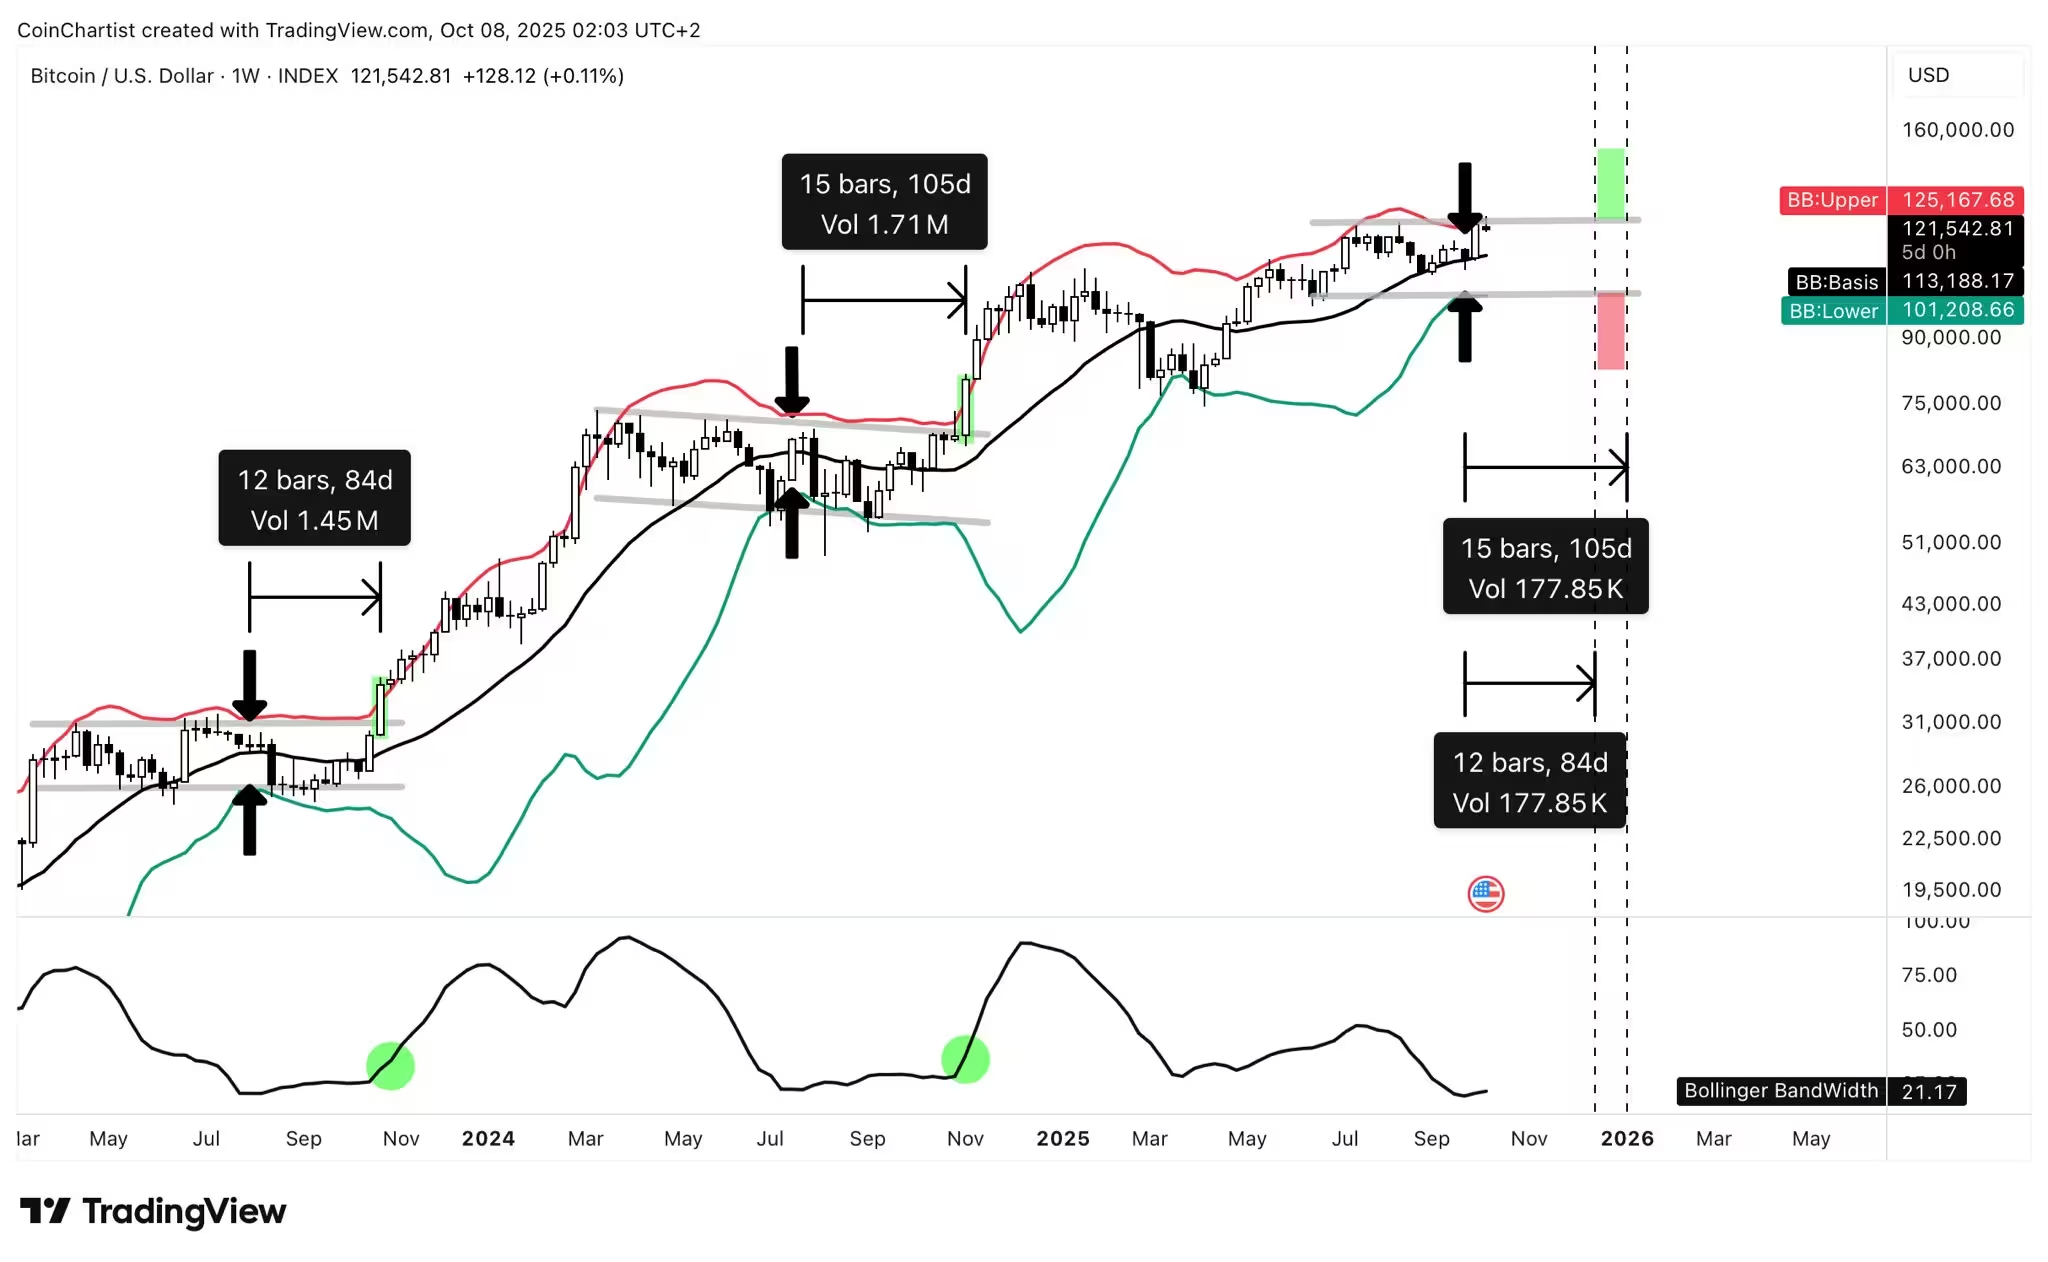
BTC/USD one-week chart with Bollinger Bands data.
What traders Tony Severino and others are watching
Trader Tony "The Bull" Severino highlighted that a decisive single daily candle closing beyond the outer Bollinger Bands would be the clearest signal of a breakout or breakdown. He warned, however, that markets can produce head fakes: an initial move above or below the bands can reverse before the genuine trend begins.
Severino’s timeline is rooted in historical patterns from the ongoing bull cycle that began in early 2023. Based on previous local consolidation ranges, he estimated it could take 100+ days to produce a valid breakout — whether upward and parabolic, or downward and market-ending.
Price discovery vs. end of the rally: two opposing outcomes
There are two high-impact scenarios:
- Upside breakout: a clean daily close above the upper band with strong volume could launch a rapid price-discovery uptrend, pushing BTC into parabolic territory and producing new all-time highs.
- Downside breakdown: a decisive drop through the lower band could mark the end of the three-year bull market, initiating a deeper correction or bear trend for Bitcoin.
Signals to watch beyond the bands
Traders typically combine Bollinger Band breaks with volume confirmation, moving average alignment, and momentum indicators (RSI, MACD) to validate a breakout. Daily candle strength and follow-through in subsequent sessions are crucial to separate real moves from head fakes.
Where cycle analysis fits in
Crypto analyst Rekt Capital has suggested the current cycle may still be evolving, noting that price cycles are lengthening rather than shortening. He has signaled the possible start of a new "price discovery uptrend," implying that upside remains plausible if price structure and volatility align.
Practical guidance for traders and investors
Risk management is key while the Bollinger Bands remain compressed. Consider these principles:
- Wait for confirmation: prefer a clear daily close outside the bands plus supporting volume.
- Use position sizing and stop orders to limit downside exposure, particularly near key support levels.
- Monitor macro drivers: liquidity, rates, and regulatory news can amplify or negate technical signals.
- Plan for both scenarios: set objective targets for a parabolic run and contingency plans if markets roll over.
Bottom line
Bitcoin is entering a decisive period driven by historic Bollinger Bands tightness. The next 100 days could deliver a parabolic ascent into fresh price discovery or an abrupt end to the current bull market. Traders and investors should watch for a confirmed daily close beyond the bands, heavy volume, and corroborating technical signals before committing to directional trades.


Leave a Comment
Comments
No comments yet. Be the first.