
3 Minutes
Aster price steadies at $1.70 amid rising USD inflows
Aster's recent pullback has found support around the $1.70 area—an important technical and structural zone that aligns with several key indicators. The token remains inside a higher-timeframe ascending channel, where corrections have repeatedly produced higher lows before upward continuations. With growing USD inflows and supportive on-chain metrics, the market structure favors a bullish rotation that could target the $2.50–$3 resistance range if momentum resumes.
Key technical confluence at $1.70
The $1.70 region is notable because it coincides with the volume-weighted average price (VWAP), the 0.618 Fibonacci retracement of the prior advance, and a fresh structural higher low. Those layers of confluence often act as strong bases for trend continuation in crypto markets. Volume behavior nearby also suggests accumulation rather than distribution: buy-side volume has been increasing as sellers thin out, which is a bullish sign for Aster price action.
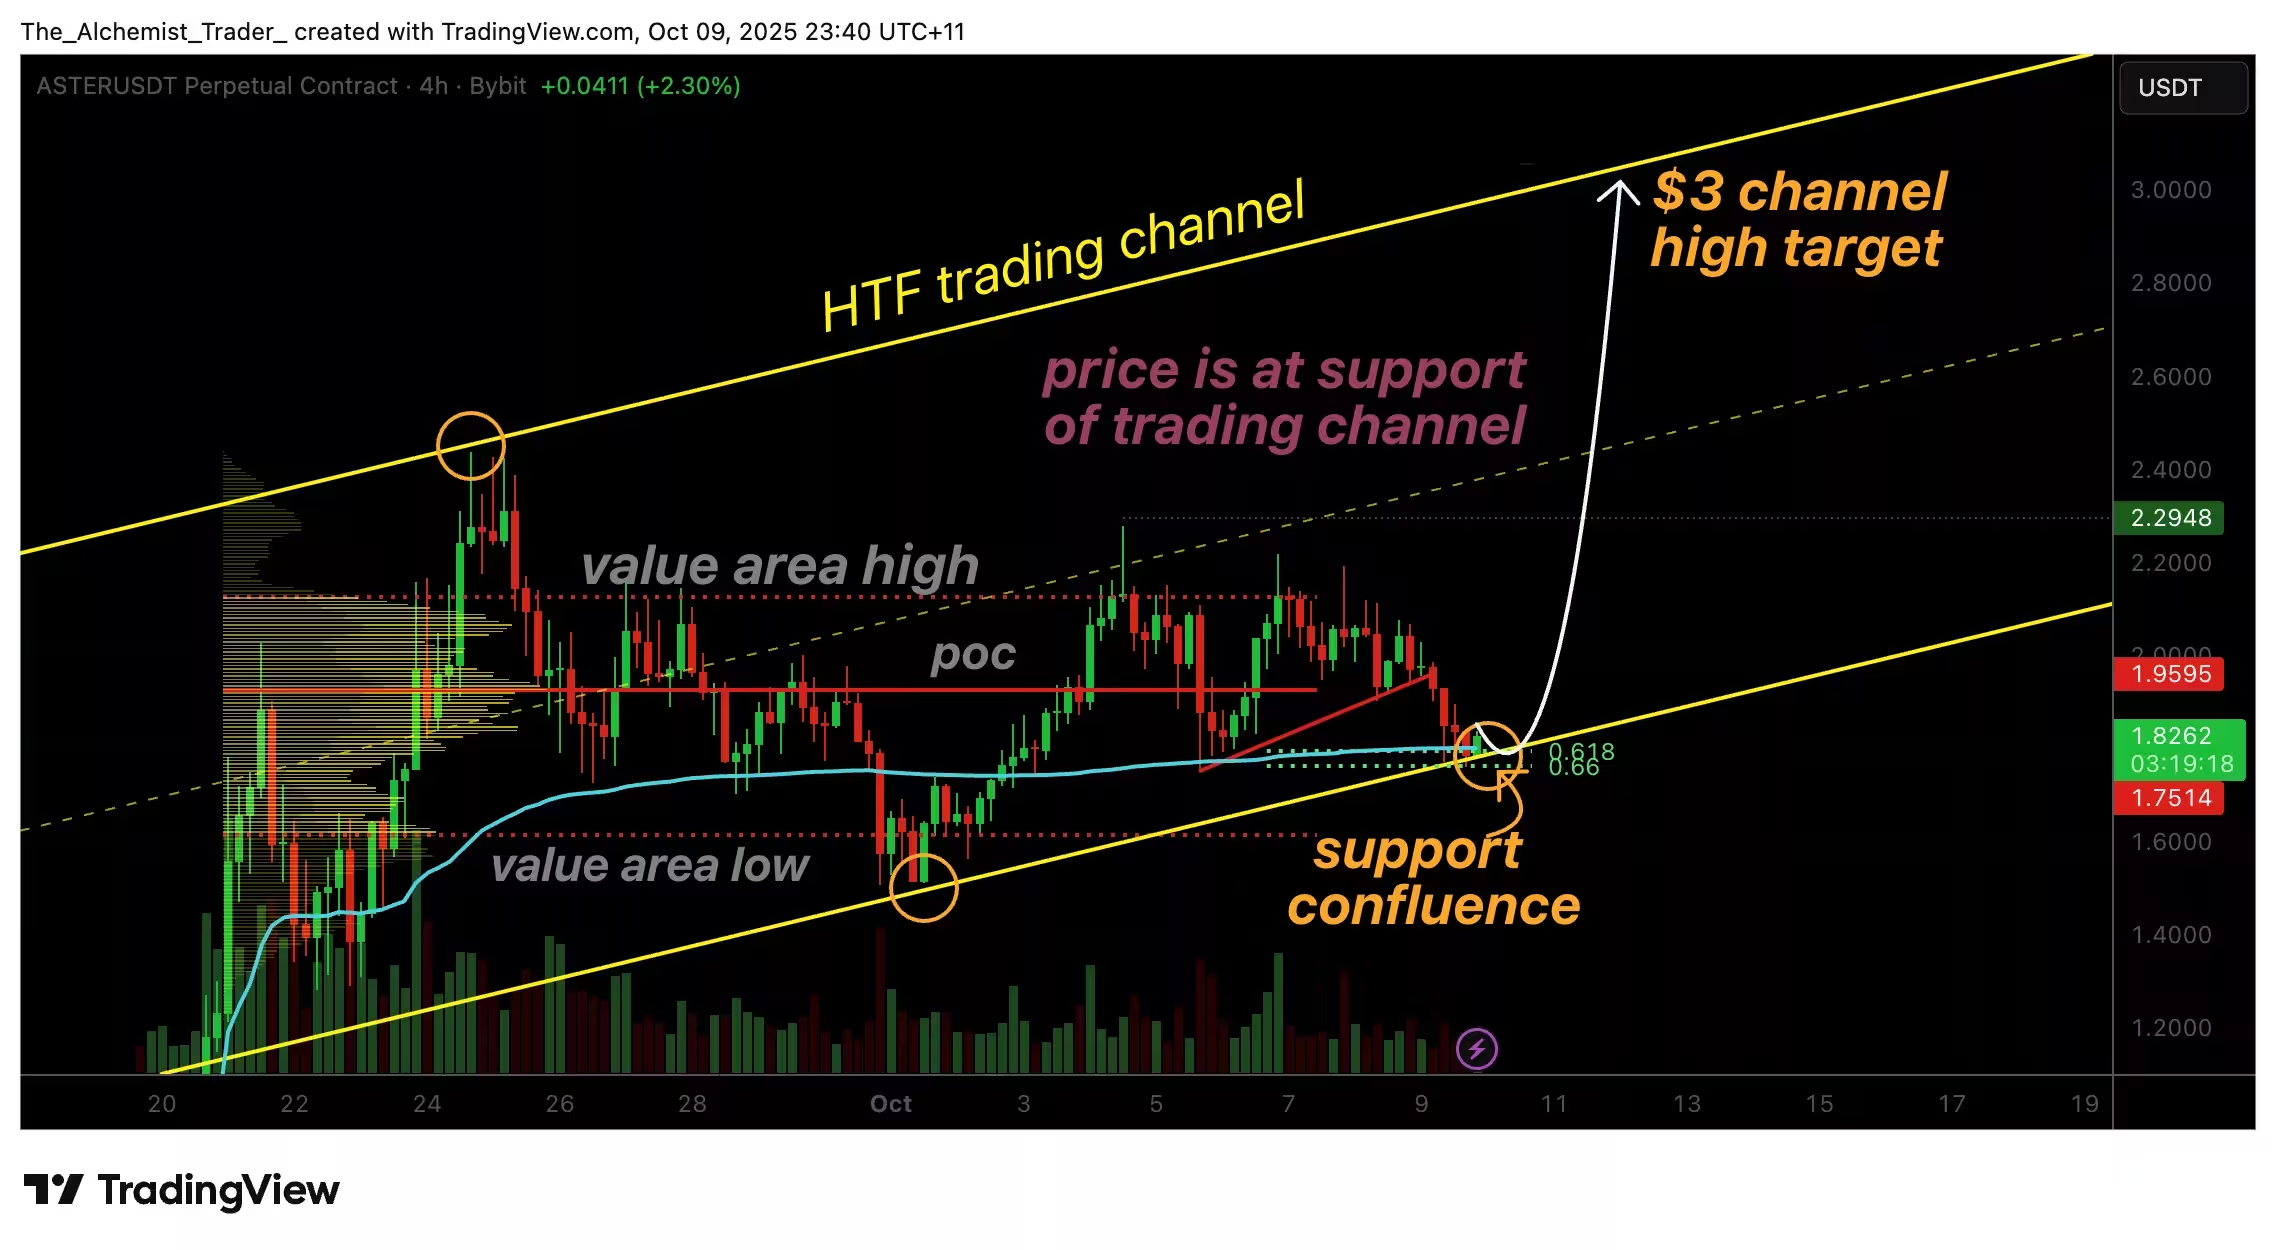
ASTER (4H) Chart
Why USD inflows matter
On-chain data over the past two weeks show meaningful USD inflows into Aster, pointing to increased investor interest and liquidity entering the ecosystem. Rising USD inflows generally indicate higher capital rotation and broader market participation, which can underpin sustained price moves. In Aster’s case, growing inflows have coincided with higher total value locked (TVL) and greater transactional activity—signals that utility demand is expanding compared with peers.
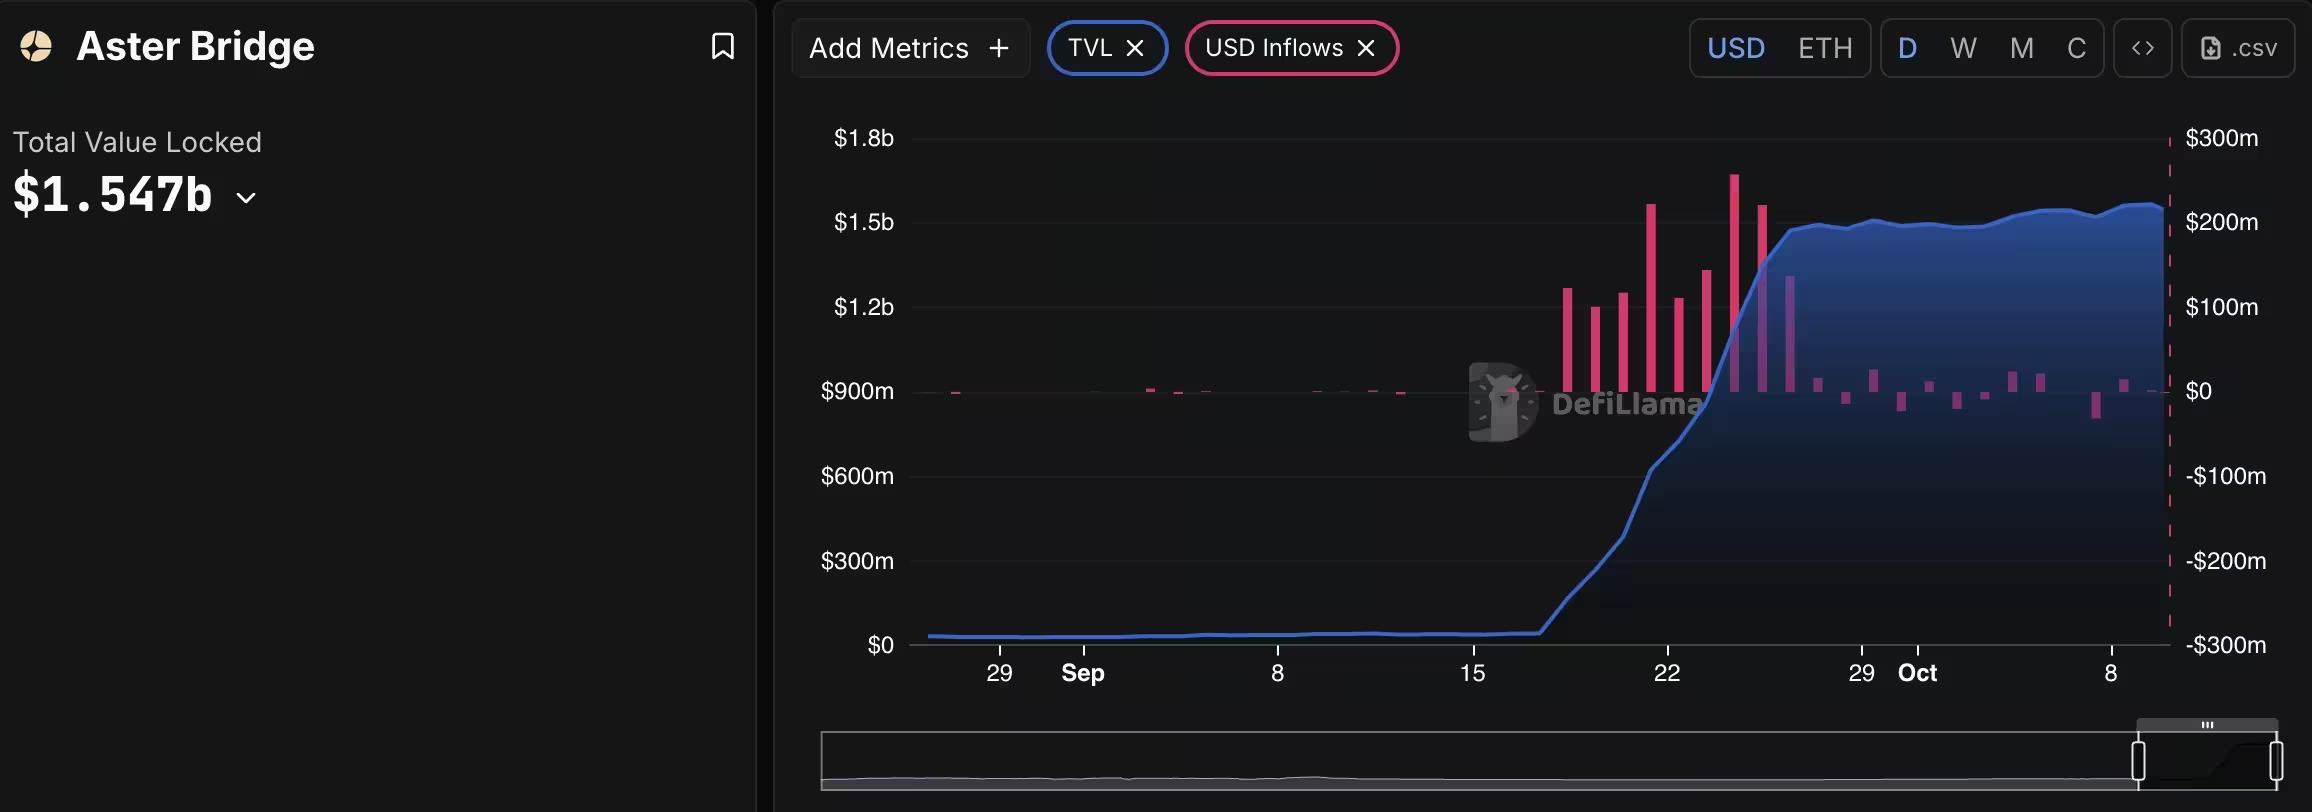
ASTER TVL and USD Inflows
What the charts and on-chain metrics imply
From a structure standpoint, the correction to $1.70 appears to be a healthy reset rather than a trend reversal. As long as Aster preserves the ascending channel and confirms a higher low above that support, the probability of a bullish rotation increases. Sustained buying volume and steady USD inflows are the most likely catalysts to push the token toward the $3 resistance level.
Traders and investors should monitor volume-weighted metrics, VWAP, and Fib levels for signs of a validated breakout. A daily close above the immediate consolidation band accompanied by above-average volume would strengthen the case for a move toward $2.50–$3. Conversely, a decisive break below the $1.70 confluence could invalidate the bullish scenario and open room for deeper consolidation.
Fundamentals and project developments
Bullish sentiment has also been supported by recent communications from Aster’s leadership. Announcements around the upcoming chain launch, token buyback initiatives, and long-term roadmap milestones help reinforce confidence in adoption and project fundamentals. When technical support coincides with concrete fundamental catalysts, the probability of a sustainable rally tends to improve.
Trading outlook and risk considerations
Short-term traders can look for accumulation signals near $1.70 with tight risk management—using the confluence zone as a reference for stop placement. Longer-term holders should track TVL growth, USD inflows, and on-chain activity as gauges of genuine demand. Remember that crypto markets are volatile: confirm breakouts with volume and macro liquidity conditions before committing significant capital.
Overall, Aster’s price structure and on-chain flows suggest a favorable risk-reward while it respects the $1.70 support. If buying pressure continues and inflows remain steady, the token has a clear path to challenge the $3 resistance over the coming weeks.


Leave a Comment
Comments
No comments yet. Be the first.